Fig. C.1.
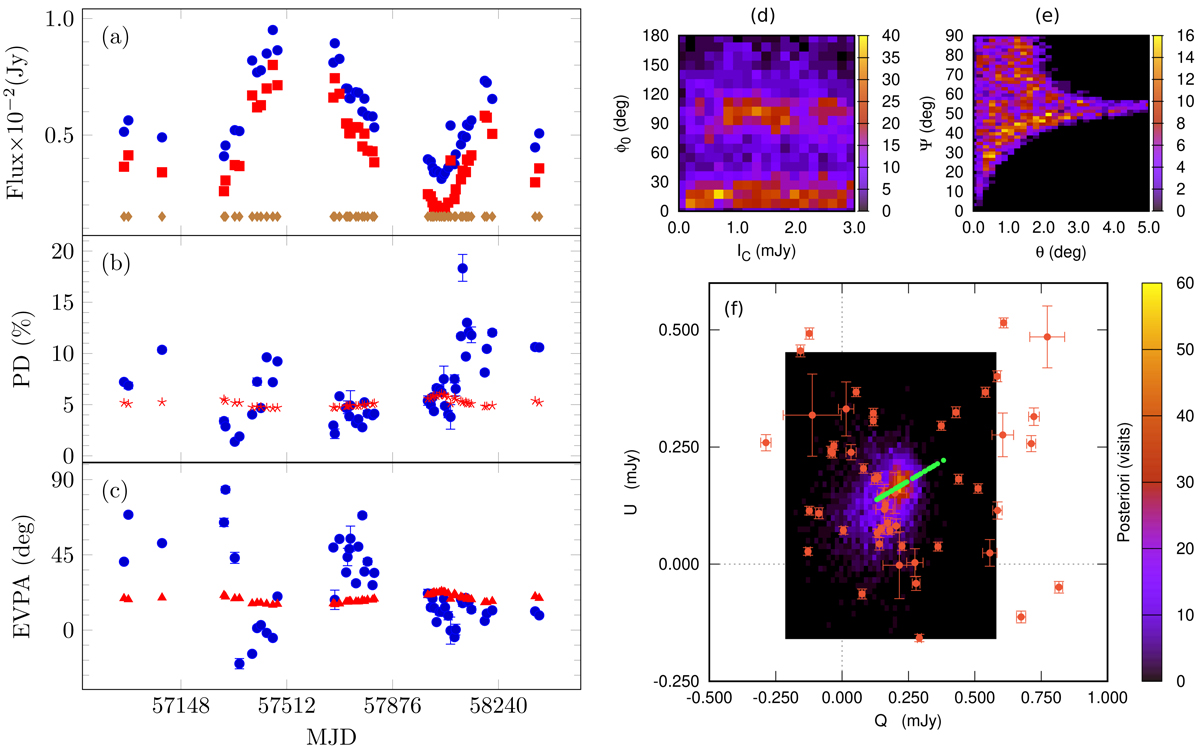
Results of polarisation analysis for VER J0521+211. Panel a: observed optical R-band flux (blue circles), variable component model (red squares), and model constant component (brown diamonds). Panel b: observed (blue circles) and modelled (red stars) optical polarisation degree. Panel c: observed (blue circle) and modelled (red triangles) electric vector polarisation angle. Panels d–f: posteriori distributions of the polarisation fitting. The colour scale gives the number of visits by the sampler in each cell. In addition, panel f shows the observations in the Q − U plane (orange) and evolution of the model (light green).
Current usage metrics show cumulative count of Article Views (full-text article views including HTML views, PDF and ePub downloads, according to the available data) and Abstracts Views on Vision4Press platform.
Data correspond to usage on the plateform after 2015. The current usage metrics is available 48-96 hours after online publication and is updated daily on week days.
Initial download of the metrics may take a while.