Fig. 1.
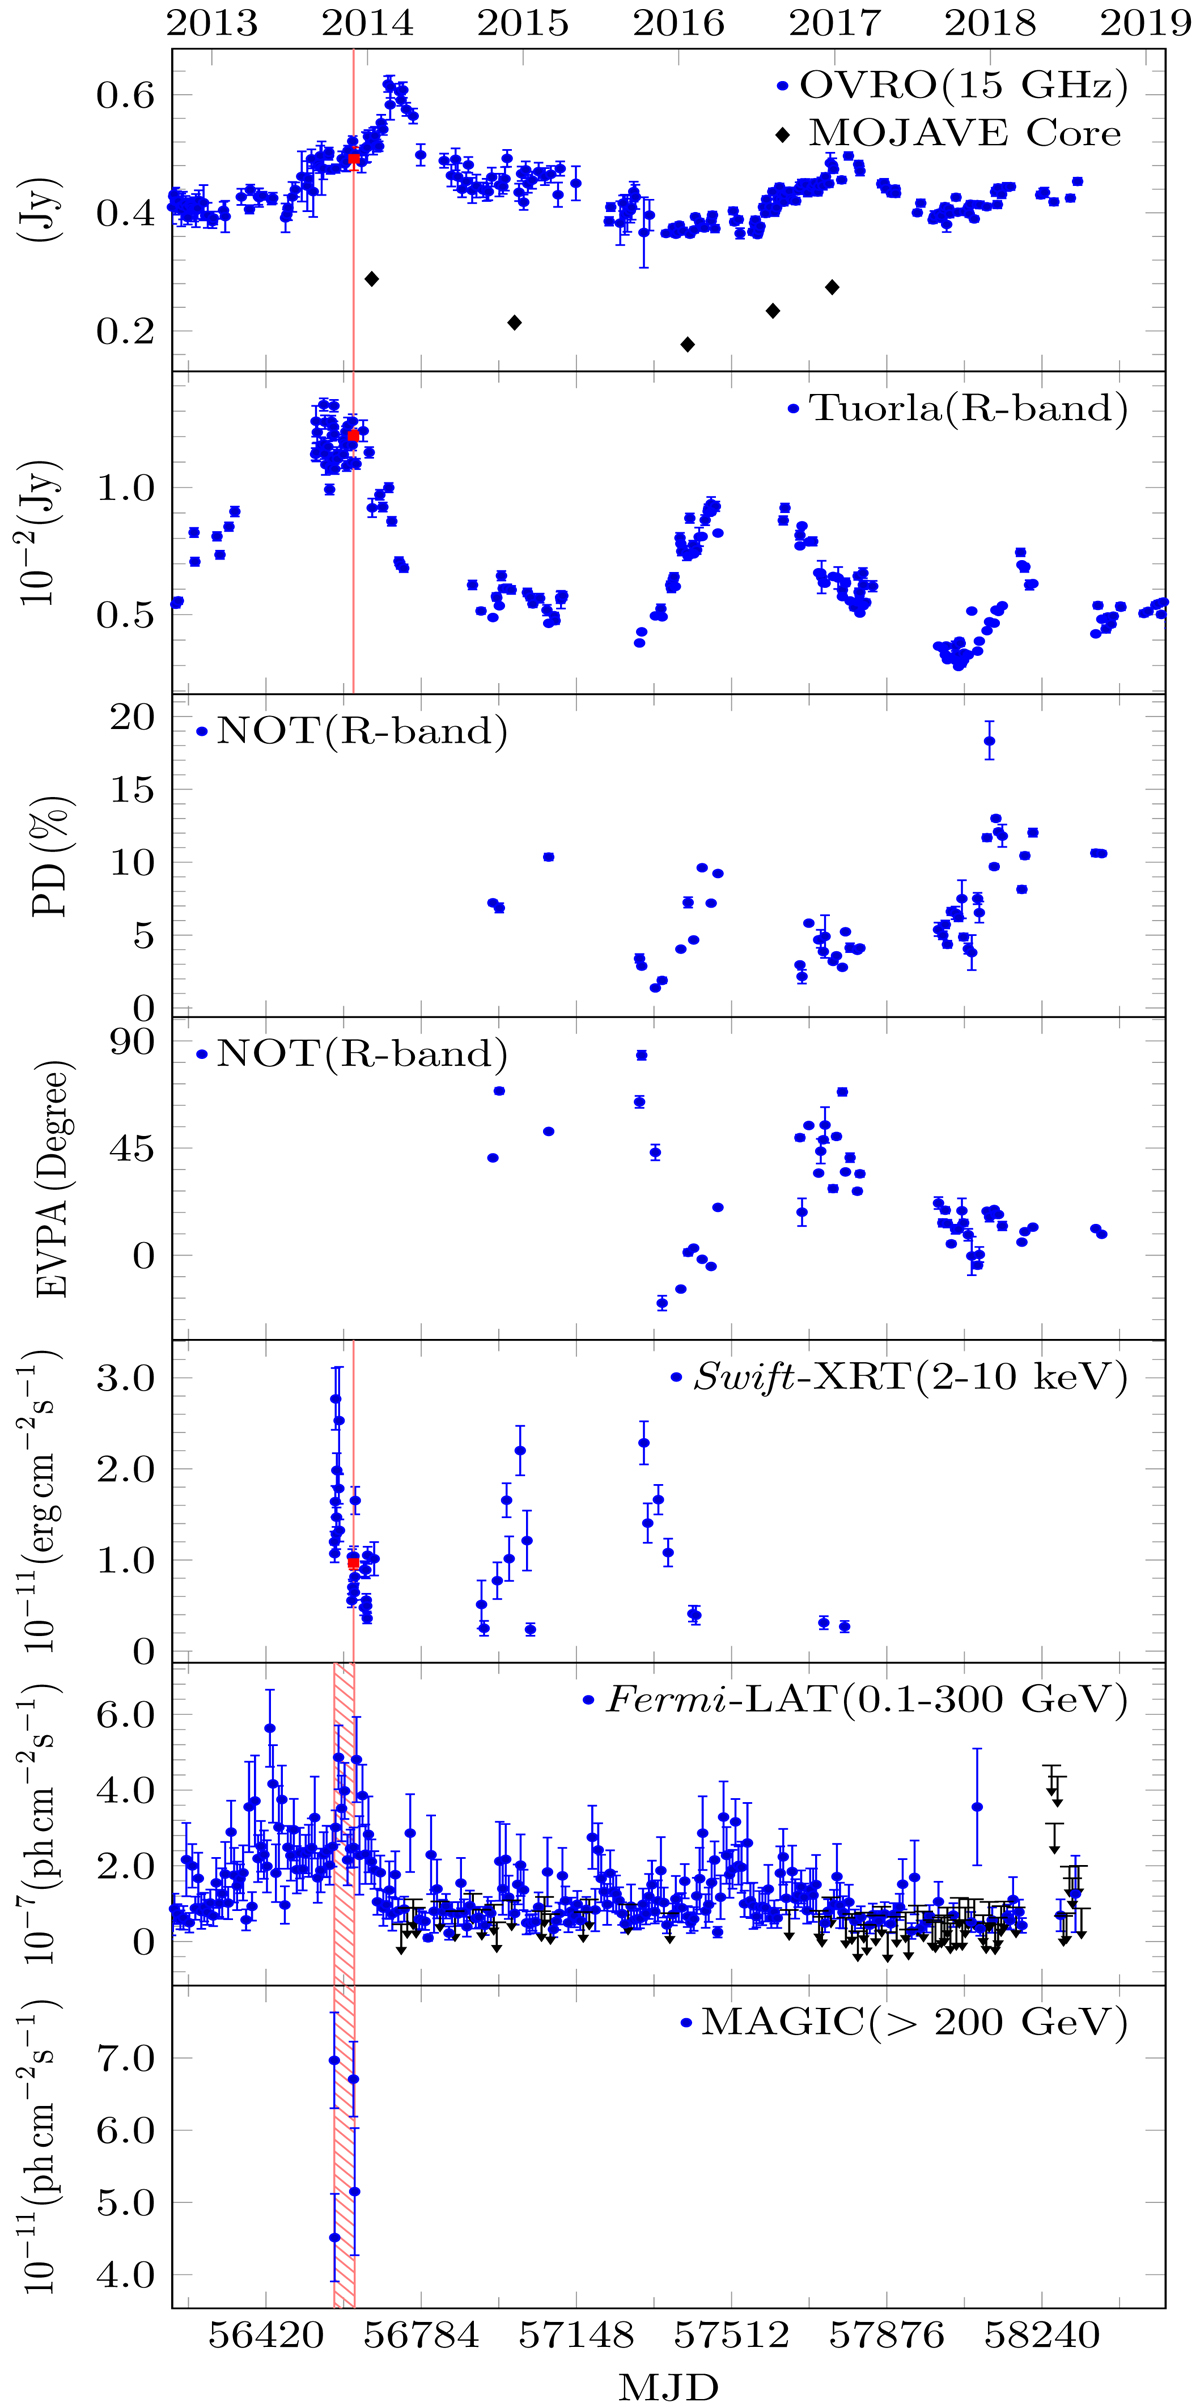
MWL light curves of VER J0521+211 in the range from MJD 56200 (2012 September 30) to 58400 (2018 October 9). From top to bottom panels: radio and VLBI core flux (15 GHz), optical (R-band), optical polarisation degree, electric vector polarisation angle, X-ray flux (2–10 keV), HE gamma-ray photon flux (0.1–300 GeV), and VHE gamma-ray photon flux above the threshold energy given in the panel. Black arrows show the 95% confidence level upper limits. The data, which are marked with vertical lines/area and squares in different bands, are used in the SED modelling.
Current usage metrics show cumulative count of Article Views (full-text article views including HTML views, PDF and ePub downloads, according to the available data) and Abstracts Views on Vision4Press platform.
Data correspond to usage on the plateform after 2015. The current usage metrics is available 48-96 hours after online publication and is updated daily on week days.
Initial download of the metrics may take a while.