Fig. 9
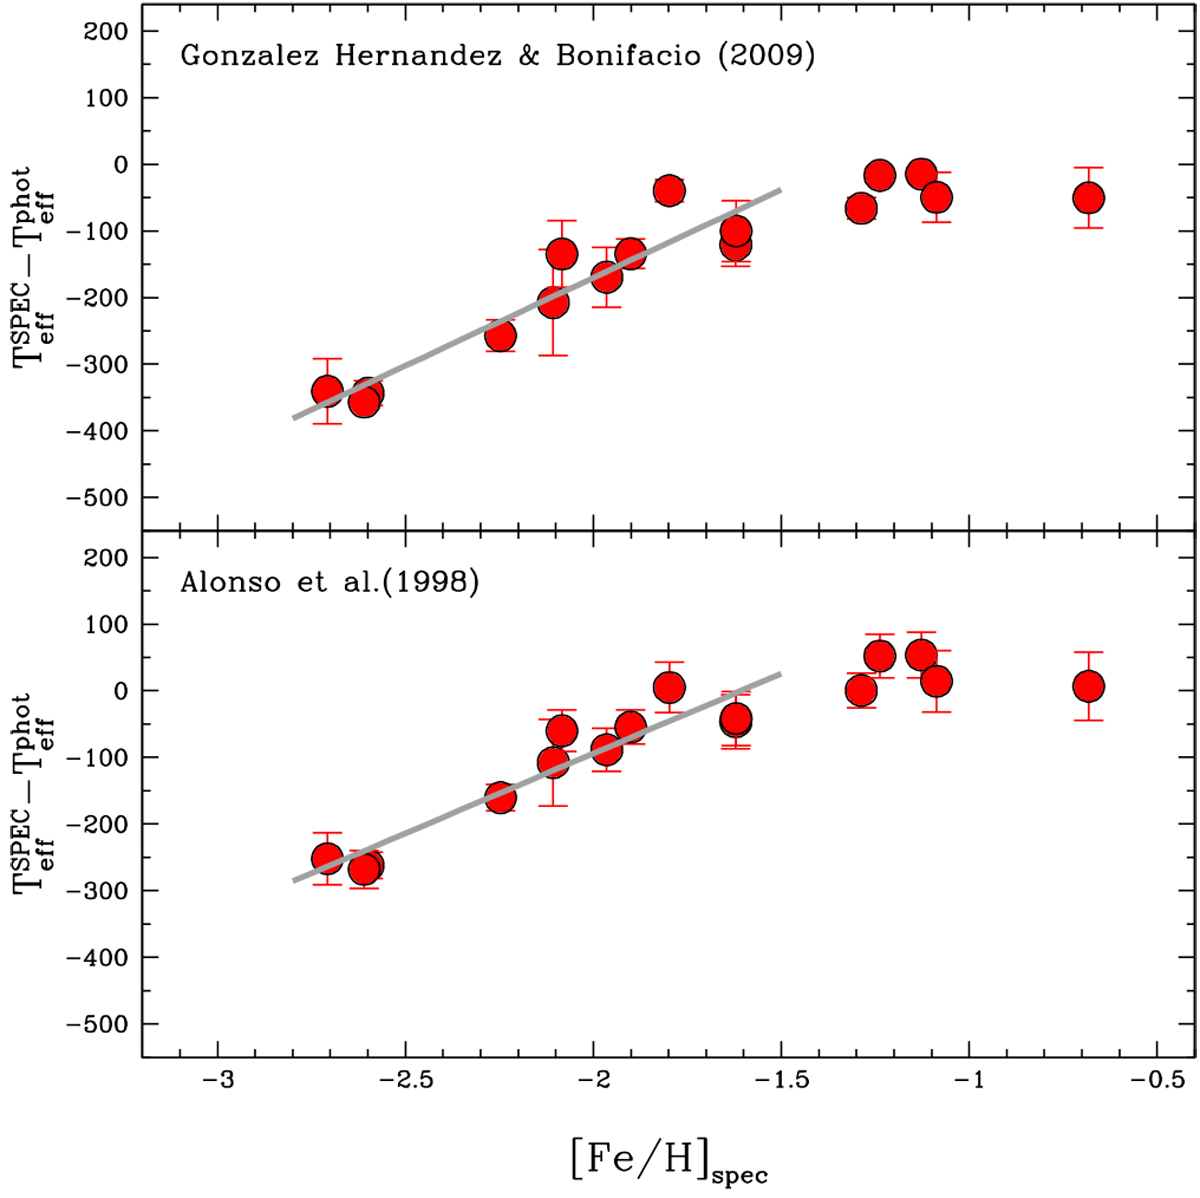
Behaviour of the average difference between the spectroscopic and photometric Teff obtained from individual colours for target clusters (red circles) as a function of the iron abundance derived adopting spectroscopic parameters. The values of Teff in the upper and lower panels were obtained with the relations of González Hernández & Bonifacio (2009) and Alonso et al. (1999), respectively. The vertical errorbars are the dispersions of the mean for Teff for each cluster. Thick grey lines are the best linear fits obtained for the clusters with [Fe/H] < –1.5 dex.
Current usage metrics show cumulative count of Article Views (full-text article views including HTML views, PDF and ePub downloads, according to the available data) and Abstracts Views on Vision4Press platform.
Data correspond to usage on the plateform after 2015. The current usage metrics is available 48-96 hours after online publication and is updated daily on week days.
Initial download of the metrics may take a while.