Free Access
Fig. 4
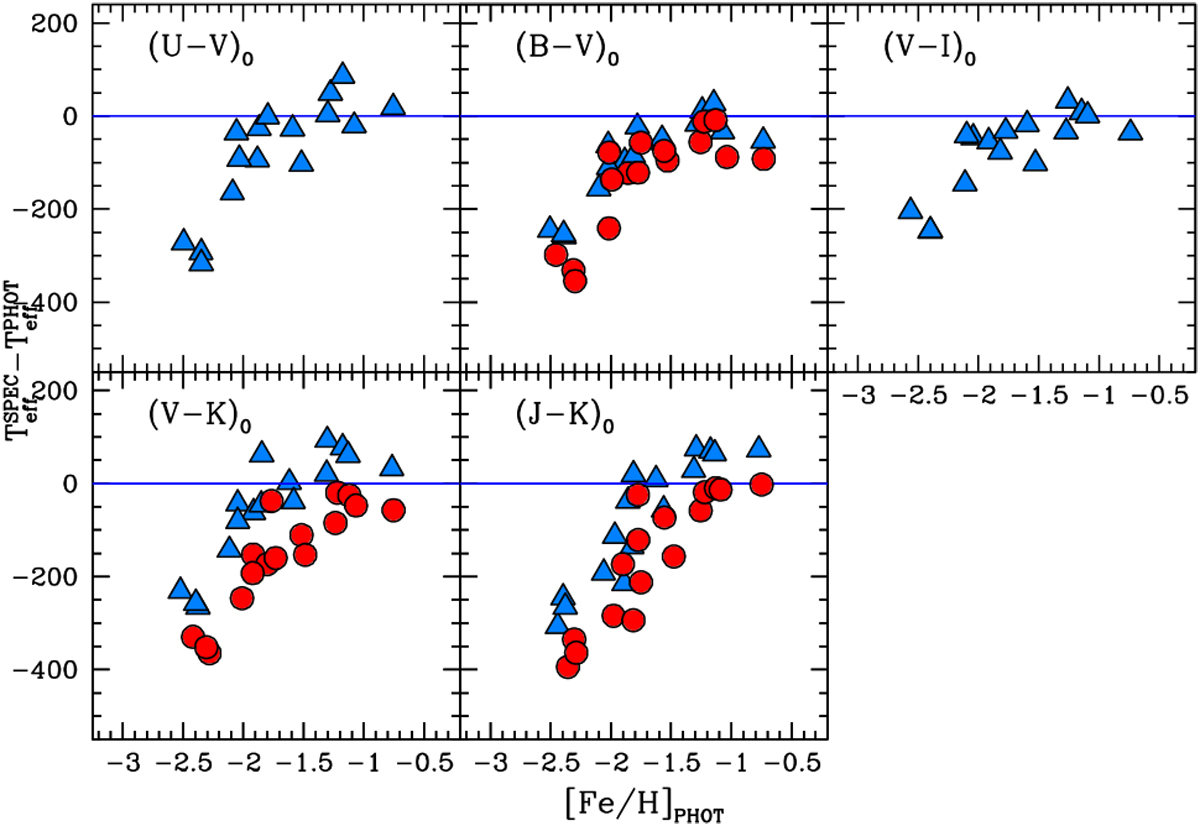
As in Fig. 1 but this time adopting the relations by Alonso et al. (1999, blue triangles) for the colours ![]() ,
,
![]() ,
,
![]() ,
,
![]() and
and ![]() , and those by González Hernández & Bonifacio (2009, red circles) for the colours
, and those by González Hernández & Bonifacio (2009, red circles) for the colours
![]() ,
,
![]() and
and ![]() . Only the average values for each target cluster are shown and not the individual stars.
. Only the average values for each target cluster are shown and not the individual stars.
Current usage metrics show cumulative count of Article Views (full-text article views including HTML views, PDF and ePub downloads, according to the available data) and Abstracts Views on Vision4Press platform.
Data correspond to usage on the plateform after 2015. The current usage metrics is available 48-96 hours after online publication and is updated daily on week days.
Initial download of the metrics may take a while.