Fig. 1
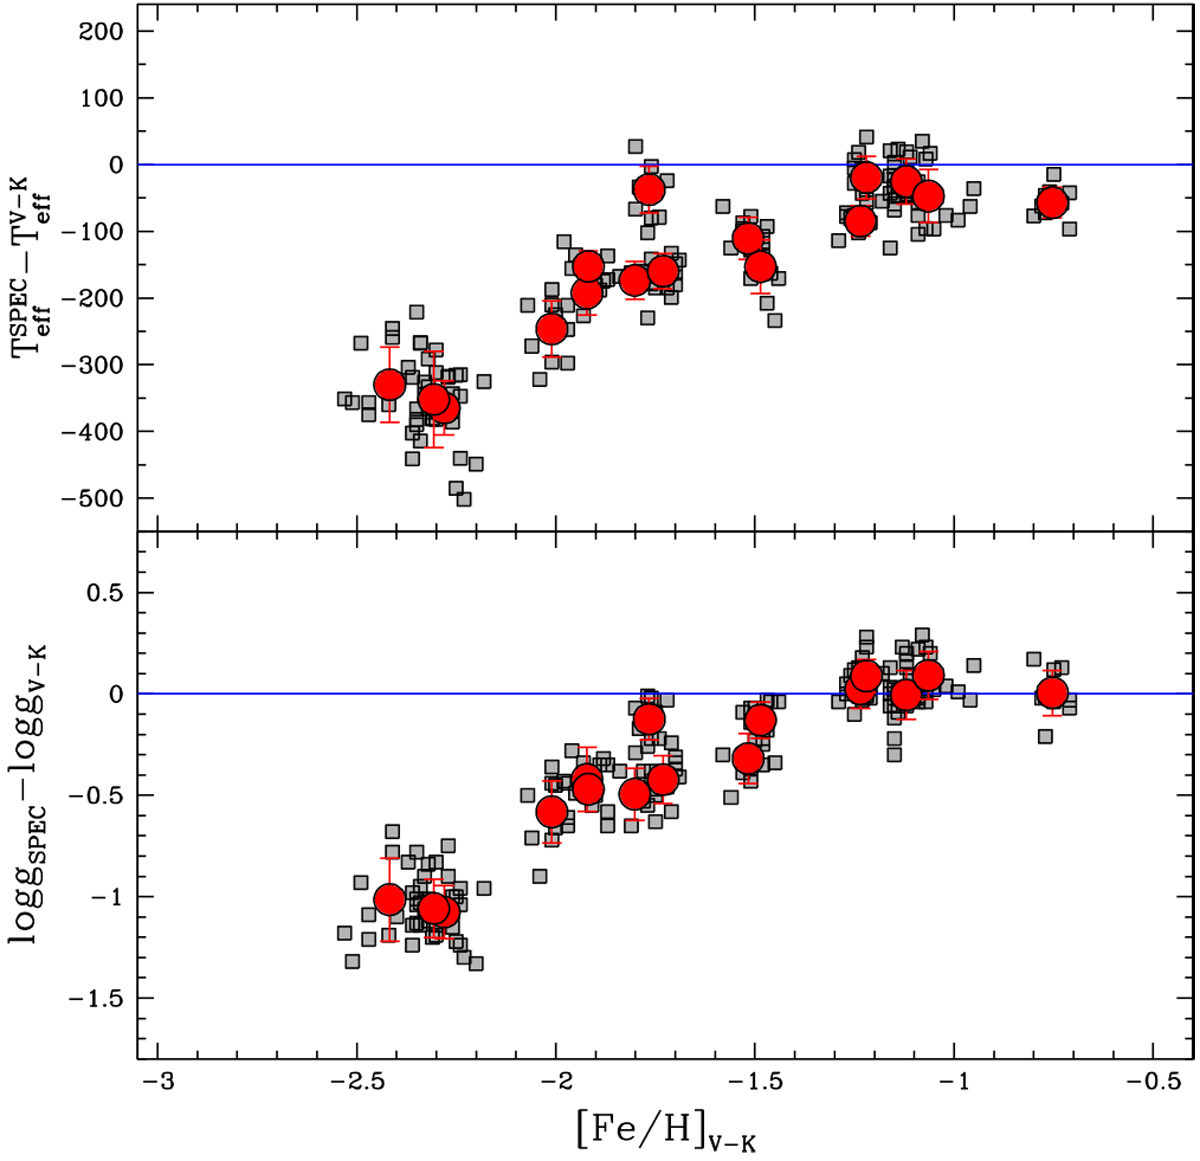
Behaviour of the difference between spectroscopic and ![]() based
Teff (upper panel) and log g (lower panel) as a function of the iron abundance [Fe/H] derived from the photometric parameters, for individual stars (small grey squares) and average values for each cluster (red points); the errorbars indicate the 1σ dispersion by the mean.
based
Teff (upper panel) and log g (lower panel) as a function of the iron abundance [Fe/H] derived from the photometric parameters, for individual stars (small grey squares) and average values for each cluster (red points); the errorbars indicate the 1σ dispersion by the mean.
Current usage metrics show cumulative count of Article Views (full-text article views including HTML views, PDF and ePub downloads, according to the available data) and Abstracts Views on Vision4Press platform.
Data correspond to usage on the plateform after 2015. The current usage metrics is available 48-96 hours after online publication and is updated daily on week days.
Initial download of the metrics may take a while.