Fig. 8
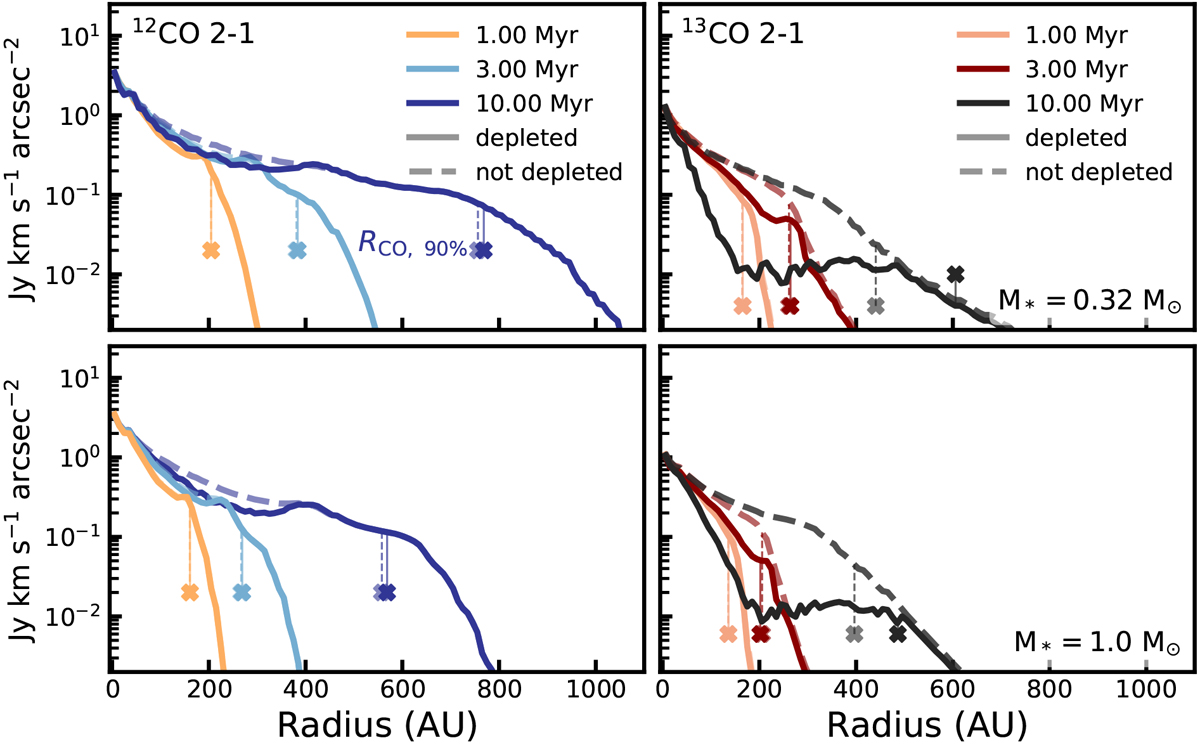
Effect of chemical CO depletion through grain-surface chemistry on the 12CO 2–1 intensityprofile (left panels) and 13CO 2–1 intensity profile (right panels) after 1 Myr (orange), 3 Myr (light blue/dark red), and 10 Myr (blue/black). Top and bottom rows:models with M* = 0.32 M⊙ and M* = 1.0 M⊙, respectively. The profile without chemical CO depletion is shown as a dashed line. The gas outer radii (RCO, 90%) are shown as a cross at arbitrary height below the profile. After 1 Myr the chemical CO depletion is not significant enough to change the intensity profile and RCO, 90%. After 10 Myr chemical CO depletion causes RCO, 90% to increase (for details, see Sect. 4.3). Figures C.1 and G.1 give a full overview of the 13CO 2–1 intensity profile of the models without and with chemical CO depletion.
Current usage metrics show cumulative count of Article Views (full-text article views including HTML views, PDF and ePub downloads, according to the available data) and Abstracts Views on Vision4Press platform.
Data correspond to usage on the plateform after 2015. The current usage metrics is available 48-96 hours after online publication and is updated daily on week days.
Initial download of the metrics may take a while.