Fig. 7
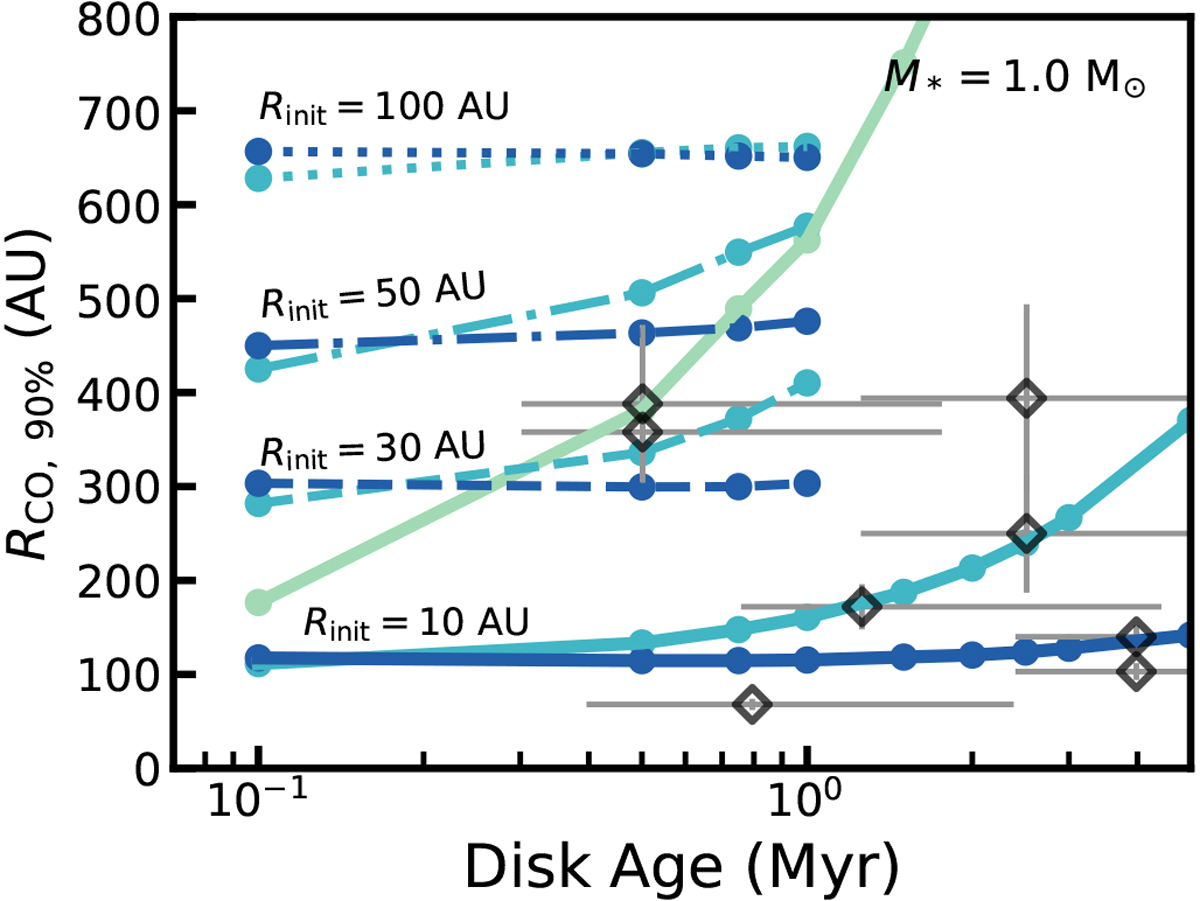
Zoom in of the bottom panel of Fig. 6, showing gas outer radii of our models (RCO, 90%) compared to observations. Also added are models with M* = 1.0 M⊙ (see Sect. 2.2) but with Rinit = 30, 50, and 100 AU denoted with dotted, dashed-dotted, and dashed lines, respectively. The colors indicated different values for αvisc. The new models were only run for αvisc = [10−3, 10−4].
Current usage metrics show cumulative count of Article Views (full-text article views including HTML views, PDF and ePub downloads, according to the available data) and Abstracts Views on Vision4Press platform.
Data correspond to usage on the plateform after 2015. The current usage metrics is available 48-96 hours after online publication and is updated daily on week days.
Initial download of the metrics may take a while.