Fig. 6
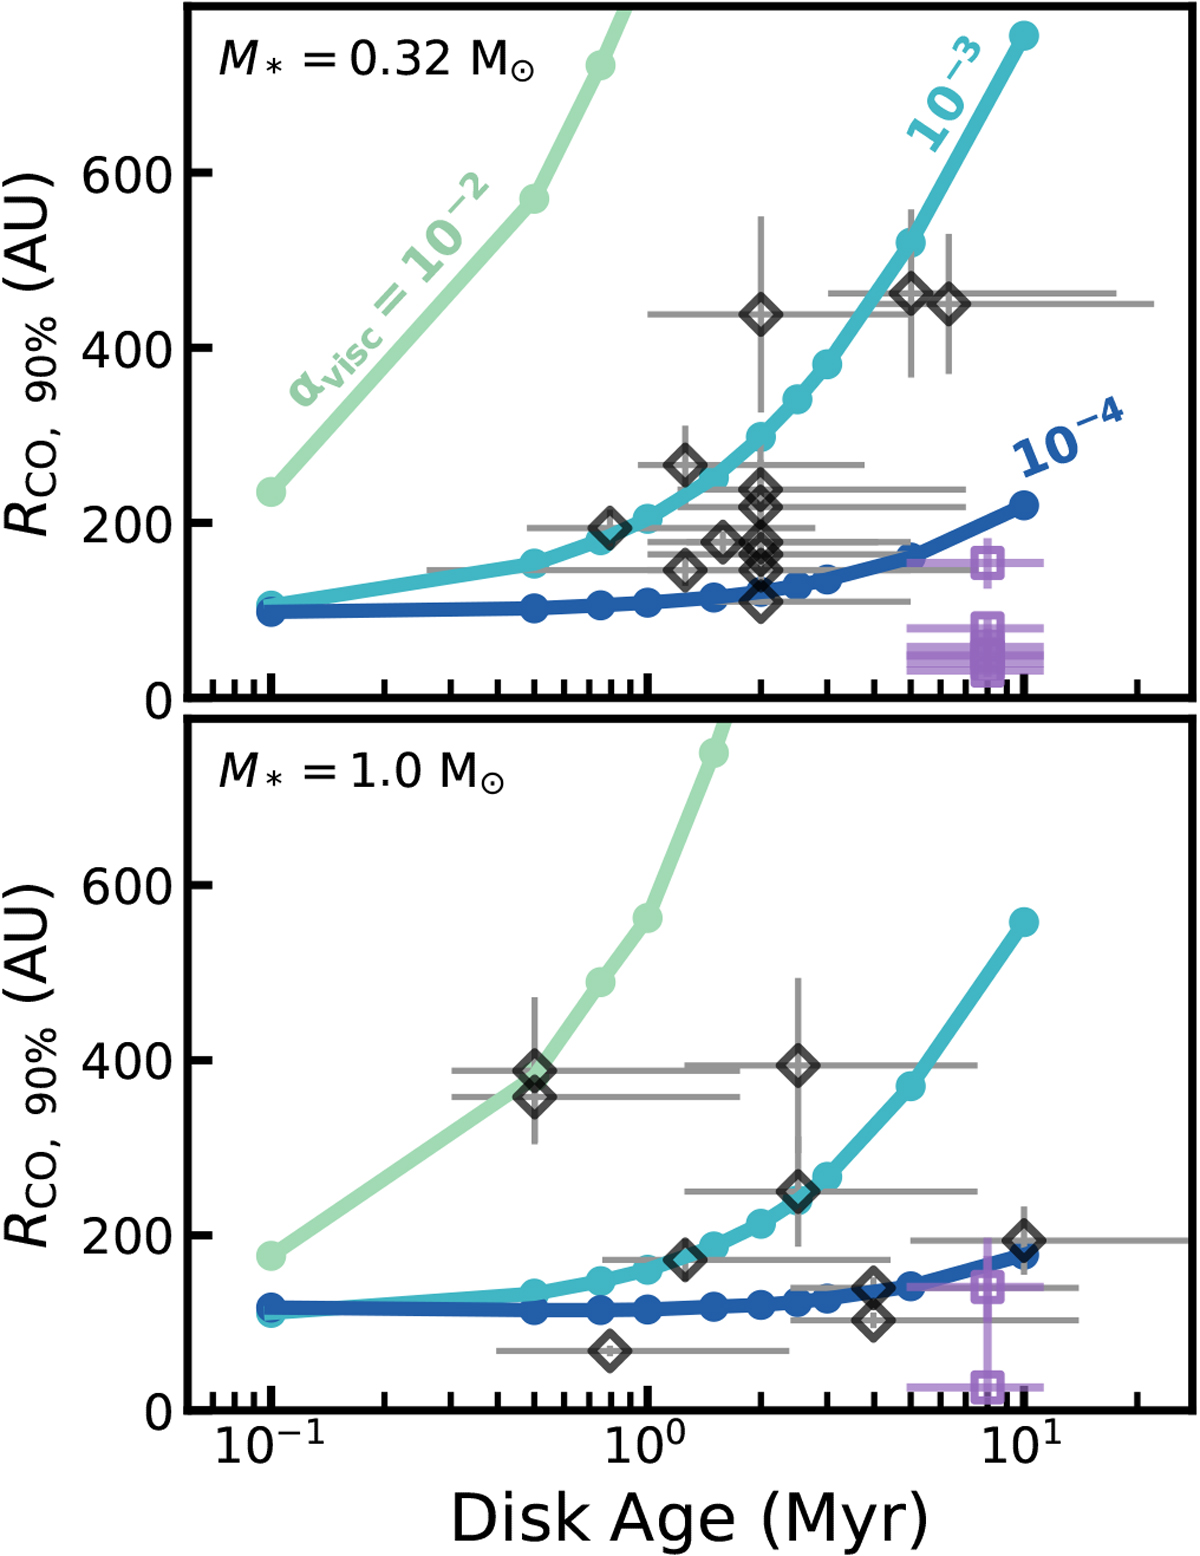
Gas outer radii of our models (RCO, 90%) compared to observations. The colors correspond to the αvisc of the model. The black open diamonds show observed gas outer radii in Lupus (Ansdell et al. 2018) and the purple open squares denote observed gas outer radii in Upper Sco (Barenfeld et al. 2017). The Upper Sco outer radii shown are 90% outer radii, calculated from their fit to the observed 12CO intensity. The top and bottom panels split models and observations based on stellar mass. The sources with M* ≤ 0.66 M⊙ are compared to models with M* = 0.32 M⊙; those with M* > 0.66 M⊙ are compared to models with M* = 1.0 M⊙. Only panels for M* = 0.32 and 1.0 M⊙ are shown because the sample of observations considered in this work does not contain any objects with M* ~ 0.1 M⊙.
Current usage metrics show cumulative count of Article Views (full-text article views including HTML views, PDF and ePub downloads, according to the available data) and Abstracts Views on Vision4Press platform.
Data correspond to usage on the plateform after 2015. The current usage metrics is available 48-96 hours after online publication and is updated daily on week days.
Initial download of the metrics may take a while.