Free Access
Fig. 2
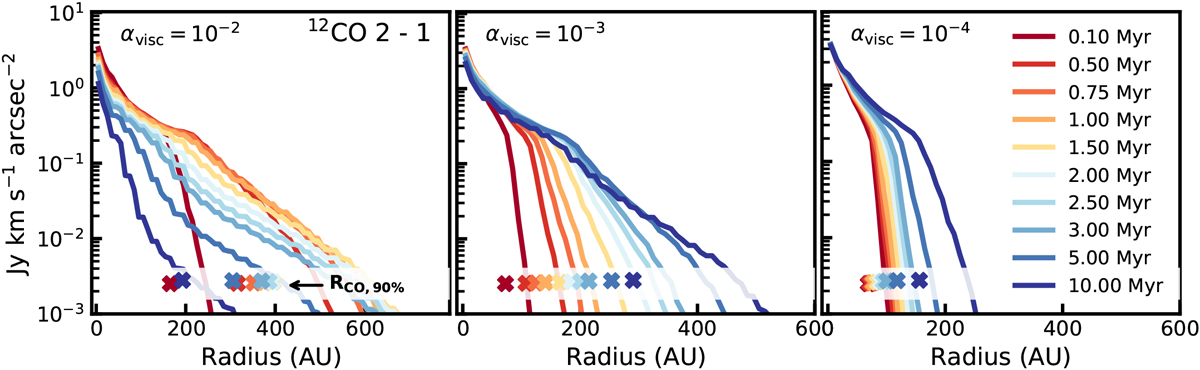
Evolution of the 12CO 2–1 radial intensity profiles for models with M* = 0.1 M⊙. The colors indicate various disk ages between 0.1 and 10 Myr. The crosses at the bottom of each panel show the gas outer radius, defined as the radius that encloses 90% of the total 12CO 2–1 flux.
Current usage metrics show cumulative count of Article Views (full-text article views including HTML views, PDF and ePub downloads, according to the available data) and Abstracts Views on Vision4Press platform.
Data correspond to usage on the plateform after 2015. The current usage metrics is available 48-96 hours after online publication and is updated daily on week days.
Initial download of the metrics may take a while.