Fig. G.1
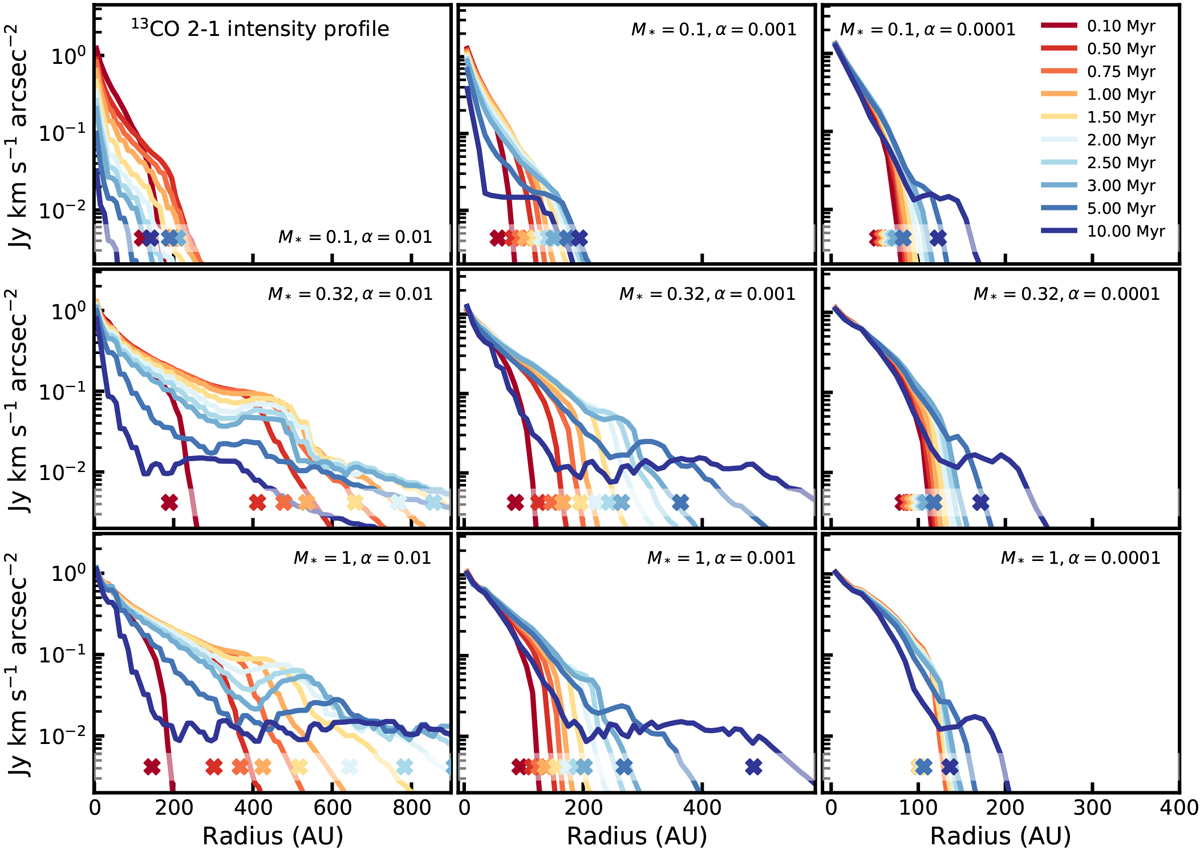
Time evolution of the 13CO intensityprofiles for our grid of models, after including the effects of chemical depletion of CO through grain surface chemistry (see Sects. 4.3 and F). Rows: models with equal stellar mass, columns: models with equal αvisc. The colors, going from red to blue, show the different time steps. For each model, the radius enclosing 90% of the total flux is indicated by a cross. A low stellar mass corresponds to a low stellar accretion rate, using the observational relation shown in Fig. 6 in Alcalá et al. (2017). Also owing to the setup, a low αvisc corresponds to a high viscous time (tvisc) and a high initial mass (Minit).
Current usage metrics show cumulative count of Article Views (full-text article views including HTML views, PDF and ePub downloads, according to the available data) and Abstracts Views on Vision4Press platform.
Data correspond to usage on the plateform after 2015. The current usage metrics is available 48-96 hours after online publication and is updated daily on week days.
Initial download of the metrics may take a while.