Fig. F.1
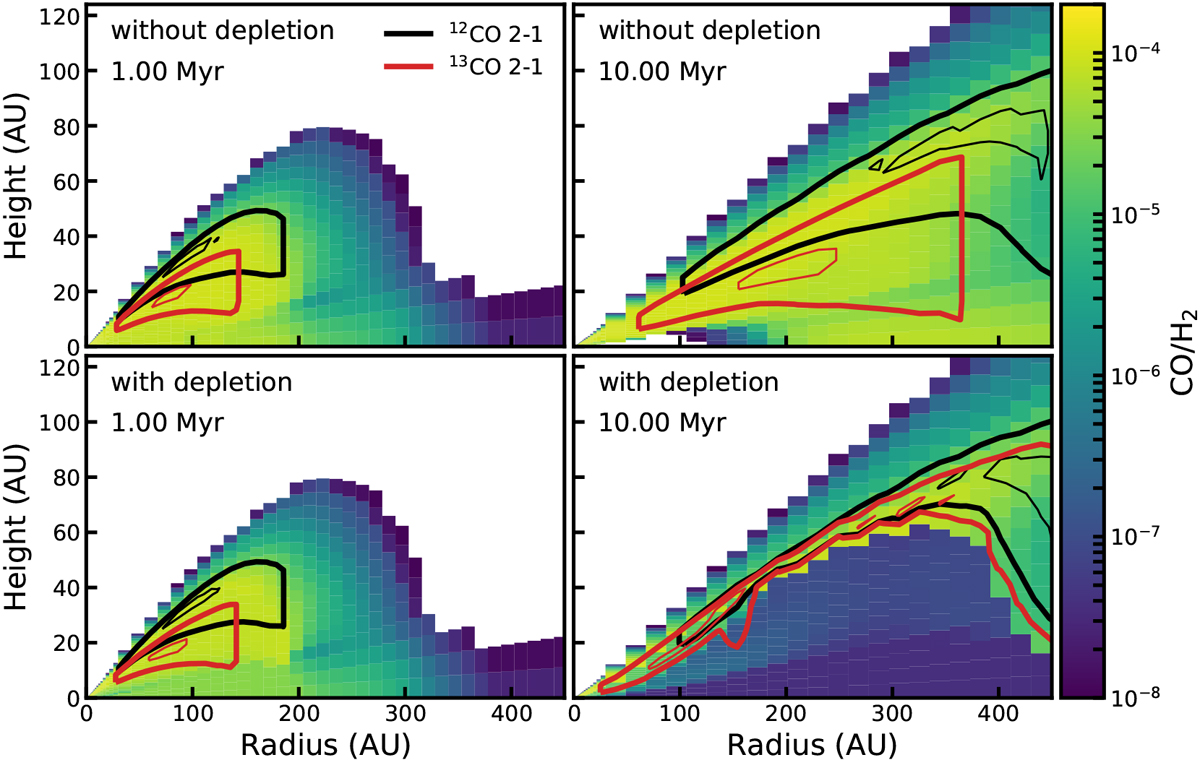
Effect of chemical depletion of CO through grain-surface chemistry on the CO abundanceafter 1 Myr (left panels) and 10 Myr (right panels). The example model shown has M* = 0.32 M⊙ and αvisc = 10−3. The colors show the CO abundance with respect to H2, where white indicates CO/H2 ≤ 10−8. The black contours show the 12CO 2–1 emittingregion, enclosing 25 and 75% of the total 12CO flux. Similarly, the red contours show the 13CO 2–1 emitting region.
Current usage metrics show cumulative count of Article Views (full-text article views including HTML views, PDF and ePub downloads, according to the available data) and Abstracts Views on Vision4Press platform.
Data correspond to usage on the plateform after 2015. The current usage metrics is available 48-96 hours after online publication and is updated daily on week days.
Initial download of the metrics may take a while.