Fig. 9.
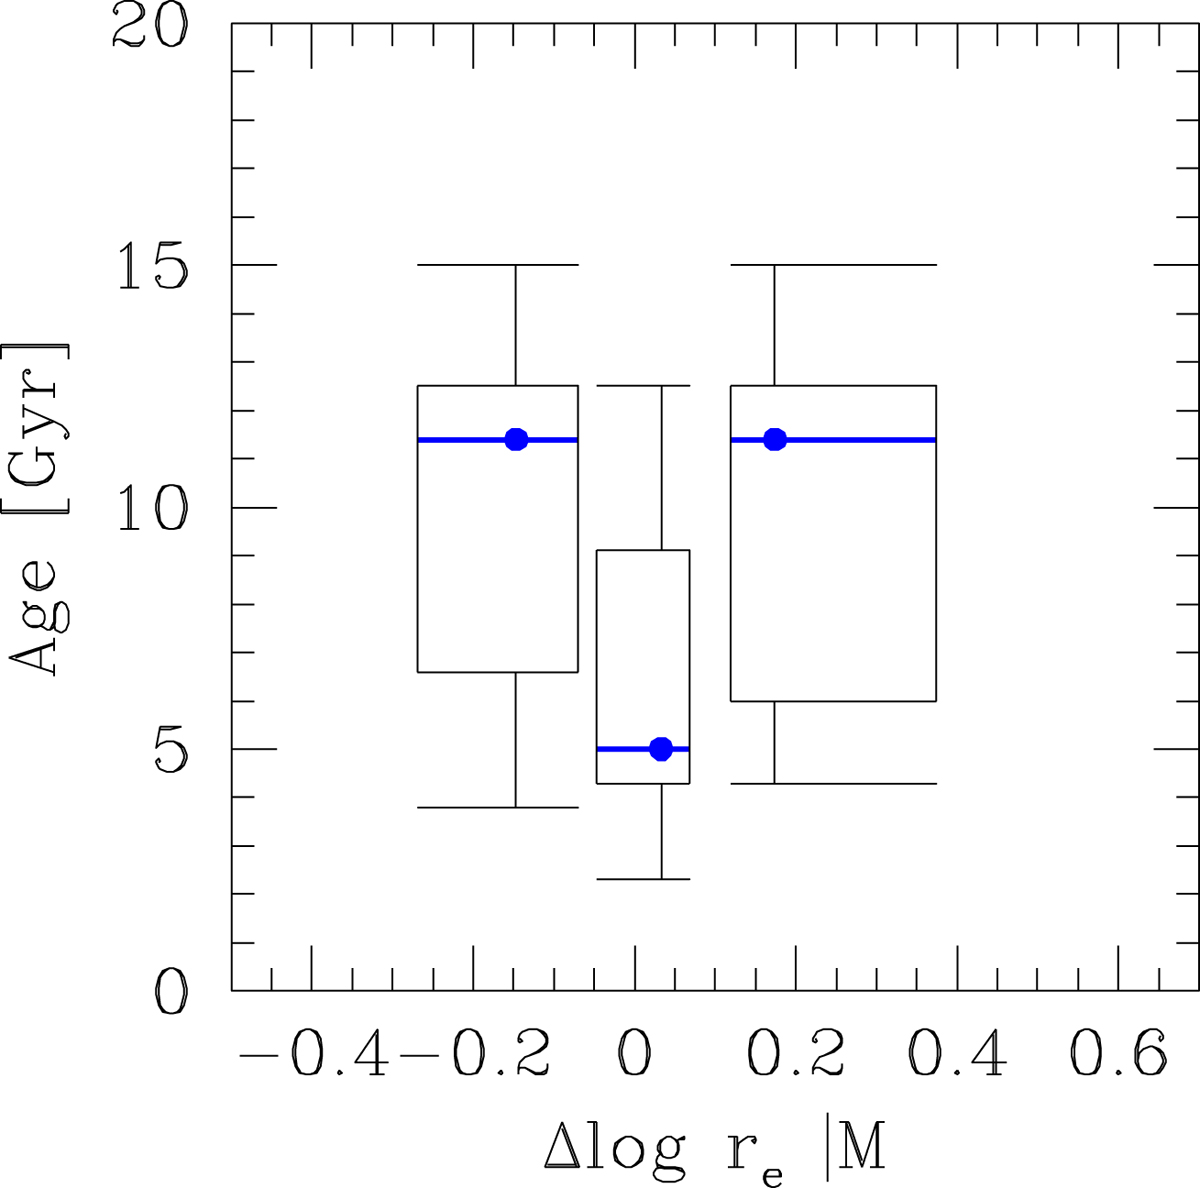
Age distribution of Coma early-type galaxies small, average, and large for their mass, respectively. The plot is a standard box-whisker; the vertical box width delimits the 1st and 3rd quartile, while the median (2rd quartile) is indicated by the blue horizontal segment inside the box. The horizontal box width gives the full x range of each bin, while the error bars reach the minimum and maximum in the ordinate. Observed ages can be older than the Universe age because of errors.
Current usage metrics show cumulative count of Article Views (full-text article views including HTML views, PDF and ePub downloads, according to the available data) and Abstracts Views on Vision4Press platform.
Data correspond to usage on the plateform after 2015. The current usage metrics is available 48-96 hours after online publication and is updated daily on week days.
Initial download of the metrics may take a while.