Fig. 2.
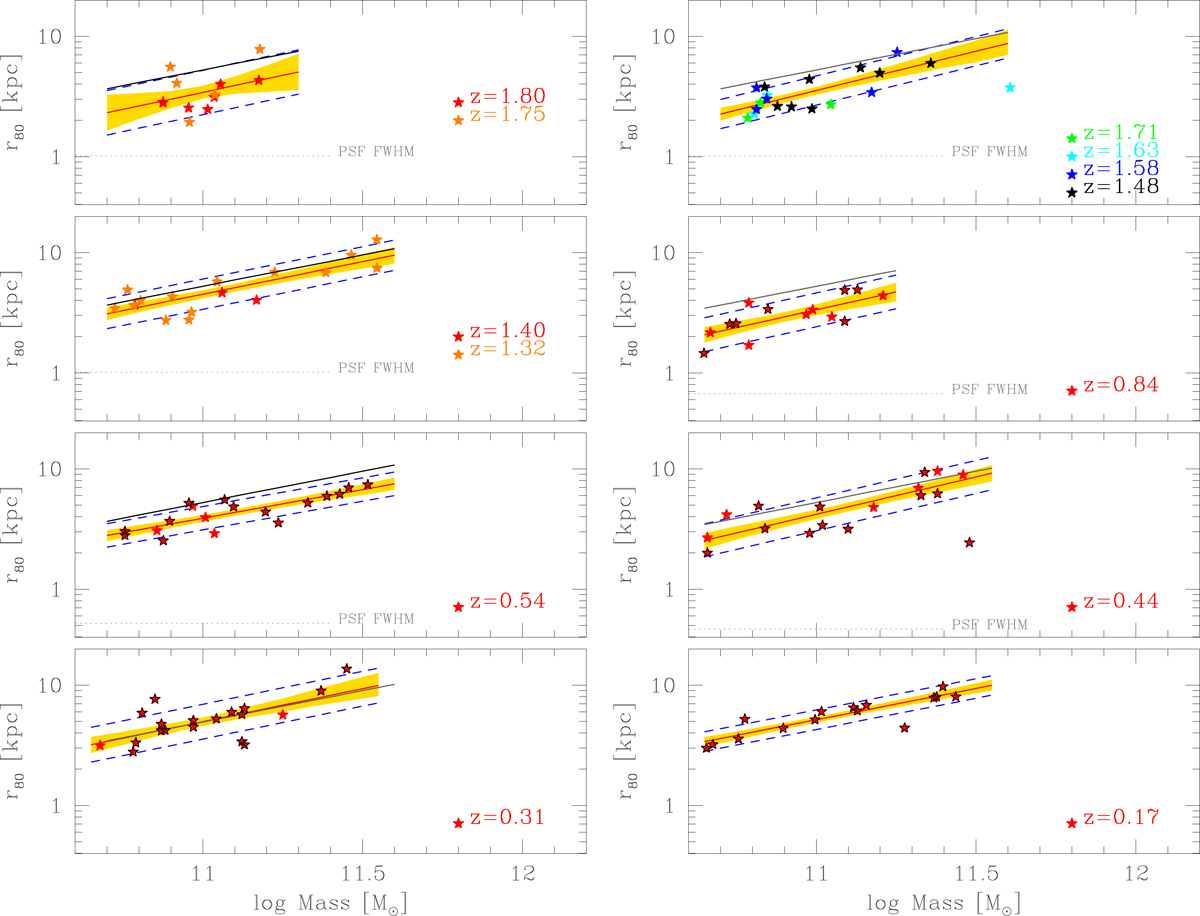
Mass-size relation of red-sequence early-type cluster galaxies. The yellow shading indicates the 68% uncertainty (posterior higher density) and the dashed blue line indicates the corridor ±1σ range around the mean model. The solid gray line (not visible in the z = 0.17 panel) shows the z = 0.17 mass-size relation. At z < 1 points with black contours are spectroscopically confirmed galaxies. The horizontal dotted line indicates the PSF full width at half maximum (FWHM, below the minimal size at low redshifts). Sizes are corrected for (negligible) PSF blurring effects.
Current usage metrics show cumulative count of Article Views (full-text article views including HTML views, PDF and ePub downloads, according to the available data) and Abstracts Views on Vision4Press platform.
Data correspond to usage on the plateform after 2015. The current usage metrics is available 48-96 hours after online publication and is updated daily on week days.
Initial download of the metrics may take a while.