Fig. 9.
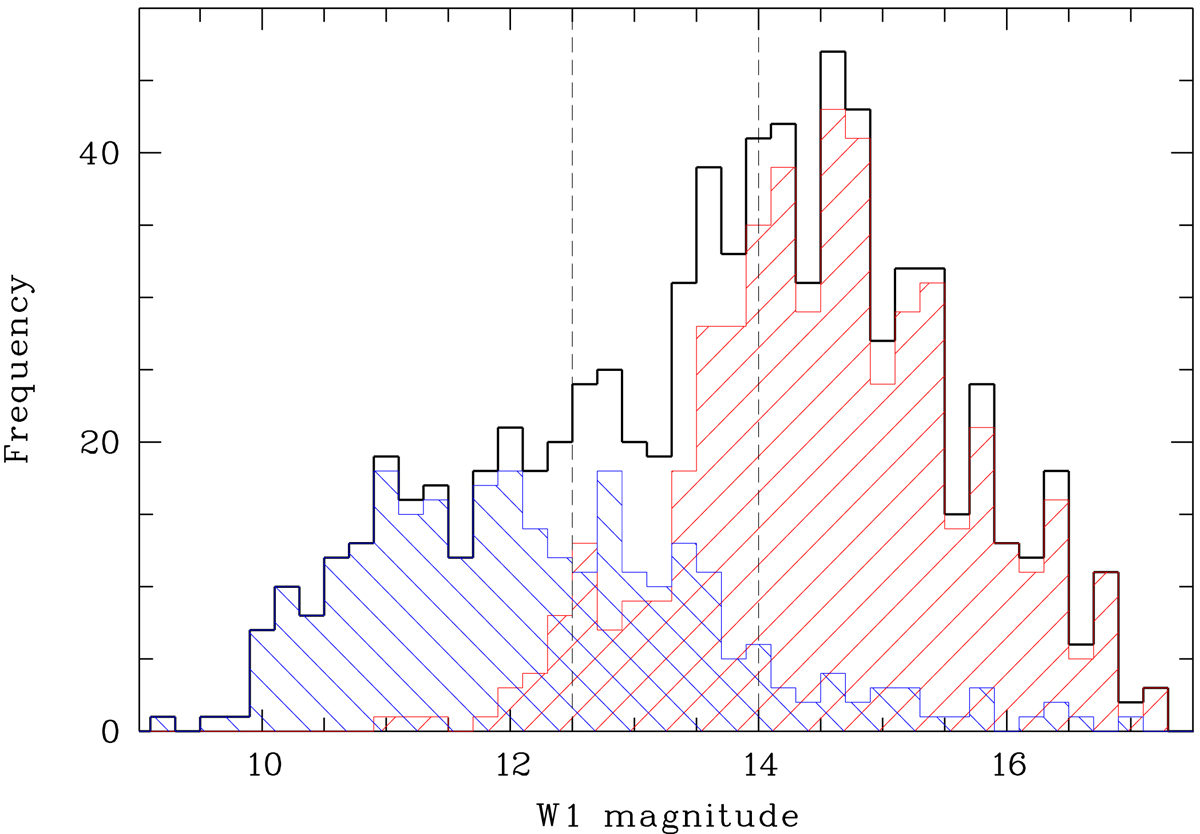
Histograms of the W1 magnitudes for the morphologically classified possible cluster members within a cluster-centric distance R = 100′ (black), the sub-sample of spectroscopically confirmed cluster members (blue), and the sub-sample of galaxies without spectroscopic redshifts (red). The two dashed vertical lines indicate the magnitude limits for MLS_W1b and MLS_W1.
Current usage metrics show cumulative count of Article Views (full-text article views including HTML views, PDF and ePub downloads, according to the available data) and Abstracts Views on Vision4Press platform.
Data correspond to usage on the plateform after 2015. The current usage metrics is available 48-96 hours after online publication and is updated daily on week days.
Initial download of the metrics may take a while.