Fig. 4.
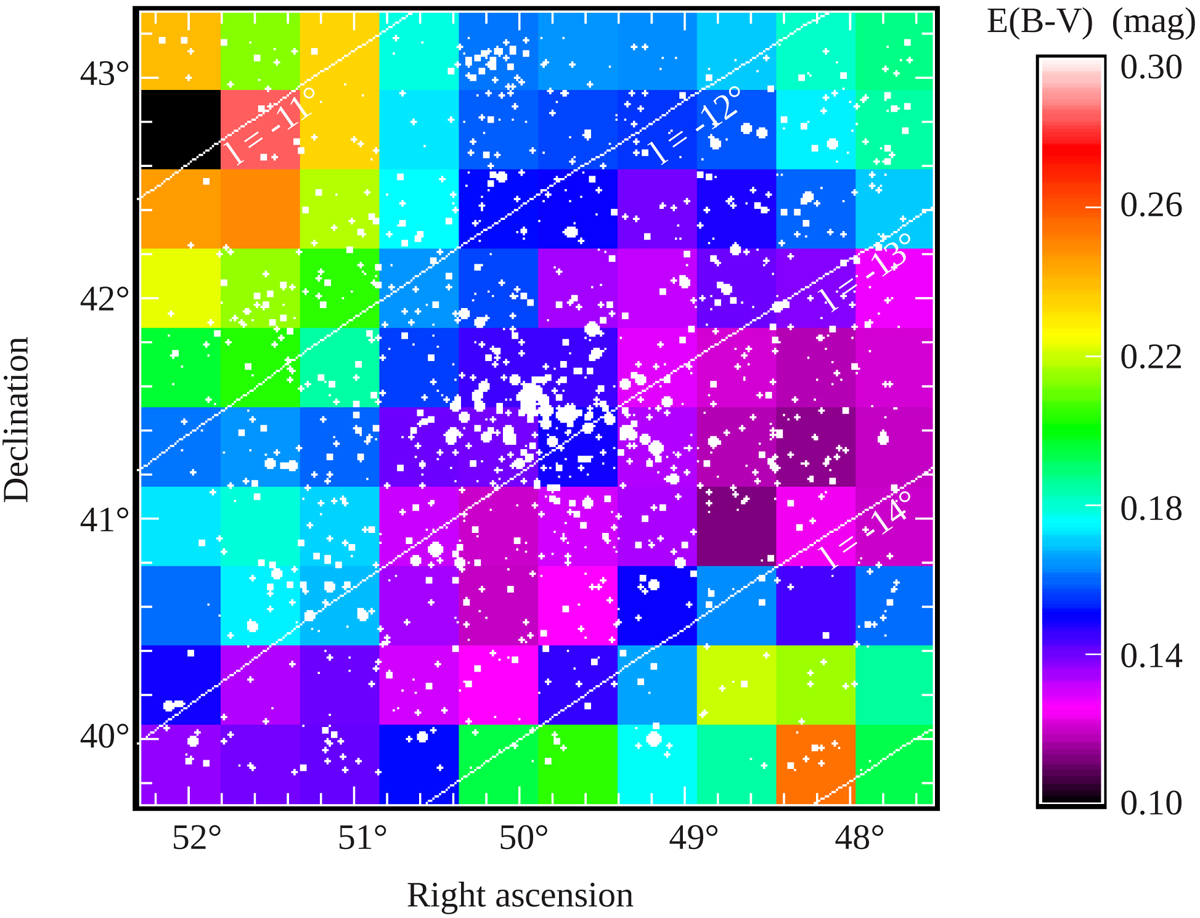
Reddening map of the Perseus cluster field. The colour indicates the reddening value E(B − V) from 0.1 (magenta) to 0.3 mag (red; see colour bar). The positions of the catalogued galaxies are over-plotted by white symbols where the symbol size scales with the brightness in the WISE W1 band. The diagonal white lines are curves of equal Galactic latitude from l = −11° (top left) to −15° (bottom right) in steps of one degree.
Current usage metrics show cumulative count of Article Views (full-text article views including HTML views, PDF and ePub downloads, according to the available data) and Abstracts Views on Vision4Press platform.
Data correspond to usage on the plateform after 2015. The current usage metrics is available 48-96 hours after online publication and is updated daily on week days.
Initial download of the metrics may take a while.