Free Access
Fig. B.2.
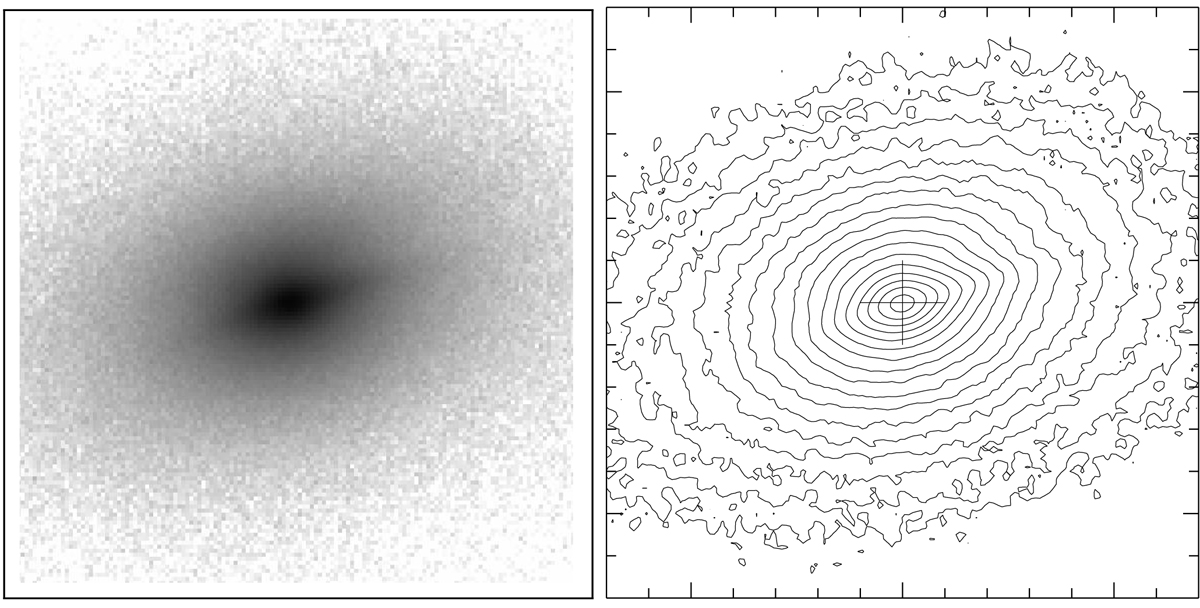
K band surface brightness distribution of J031646.7+400013. Left: direct image (side length 14″). Right: contour plot (logarithmic scale). N up, E left.
Current usage metrics show cumulative count of Article Views (full-text article views including HTML views, PDF and ePub downloads, according to the available data) and Abstracts Views on Vision4Press platform.
Data correspond to usage on the plateform after 2015. The current usage metrics is available 48-96 hours after online publication and is updated daily on week days.
Initial download of the metrics may take a while.