Fig. 35.
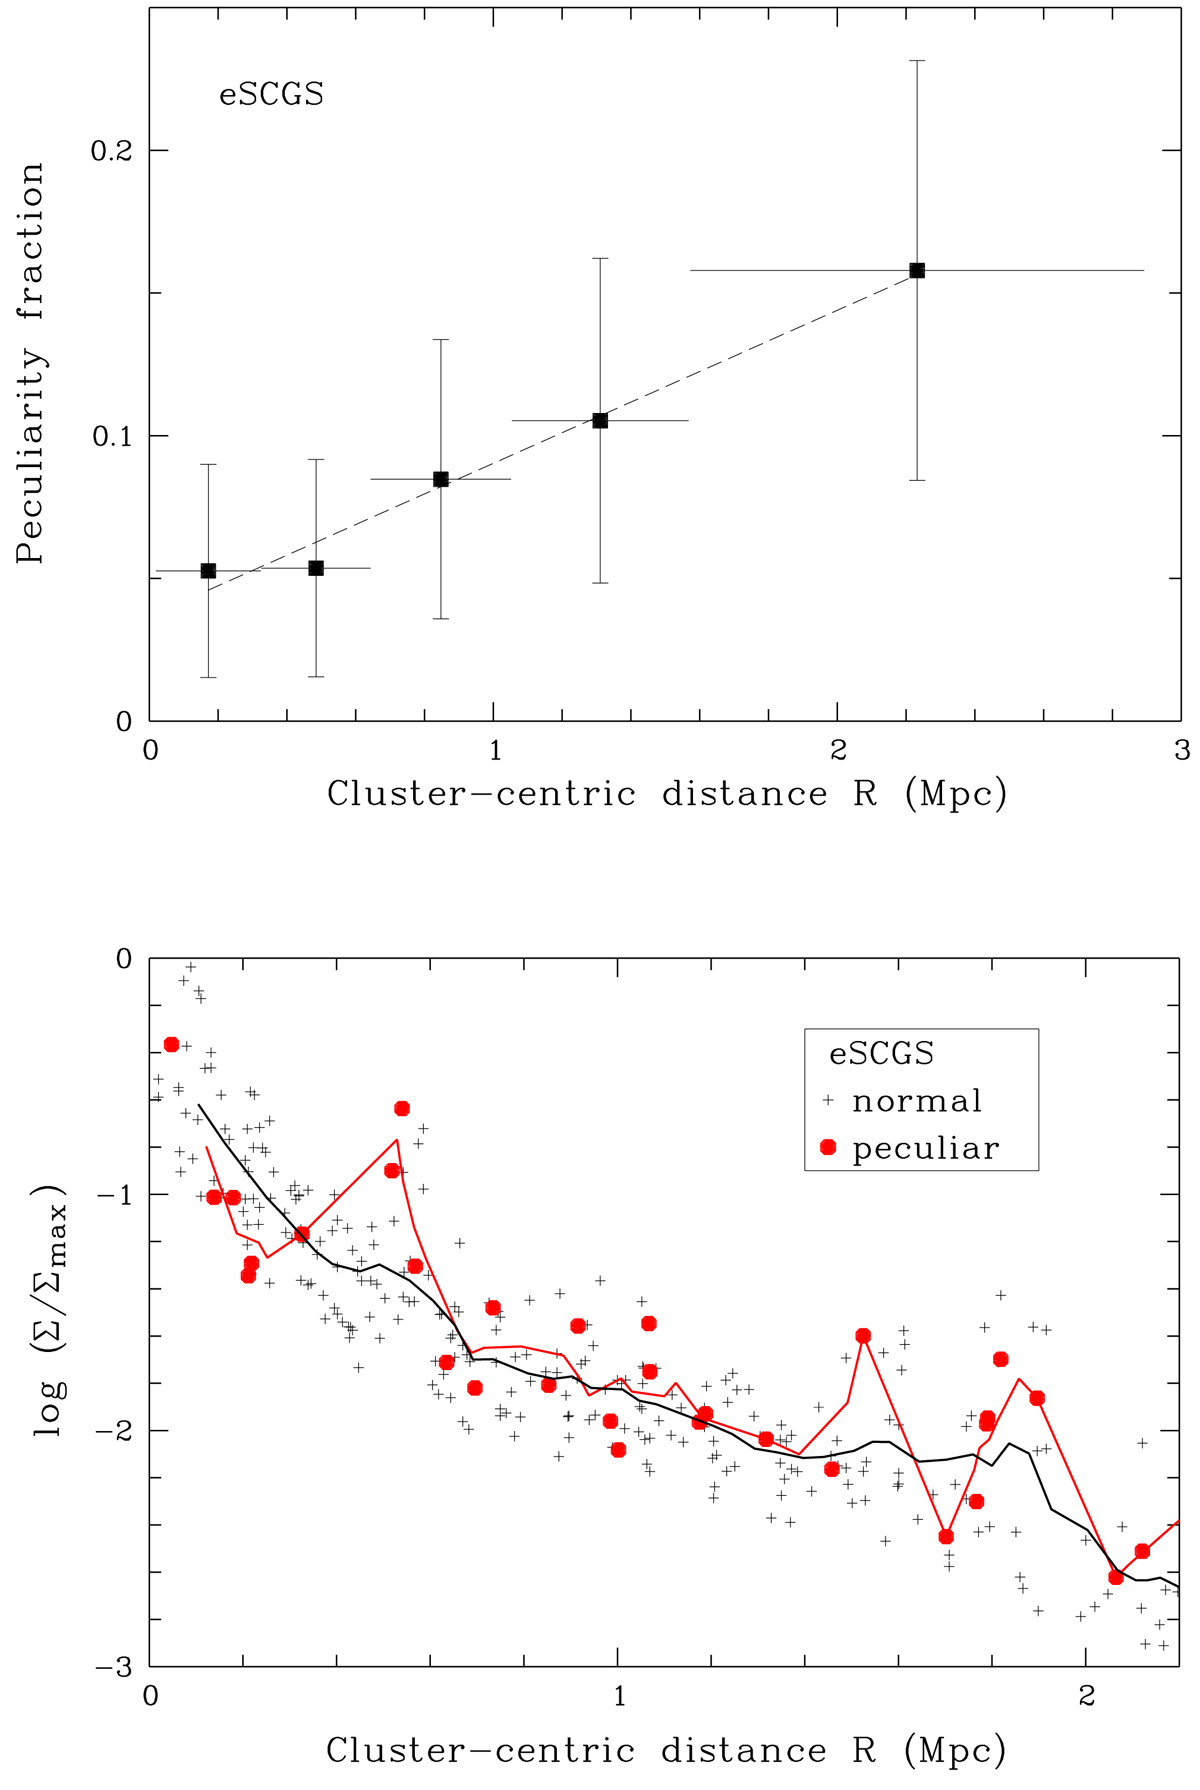
Top: peculiarity fraction of the eSCGS galaxies in five R bins. Vertical bars are counting errors, horizontal bars mark the bin widths. Each bin contains approximately the same proportion of galaxies from the parent sample. Bottom: Σ − R diagram for normal (black) and peculiar (red) galaxies. The polygons signify the mean relations.
Current usage metrics show cumulative count of Article Views (full-text article views including HTML views, PDF and ePub downloads, according to the available data) and Abstracts Views on Vision4Press platform.
Data correspond to usage on the plateform after 2015. The current usage metrics is available 48-96 hours after online publication and is updated daily on week days.
Initial download of the metrics may take a while.