Free Access
Fig. 34.
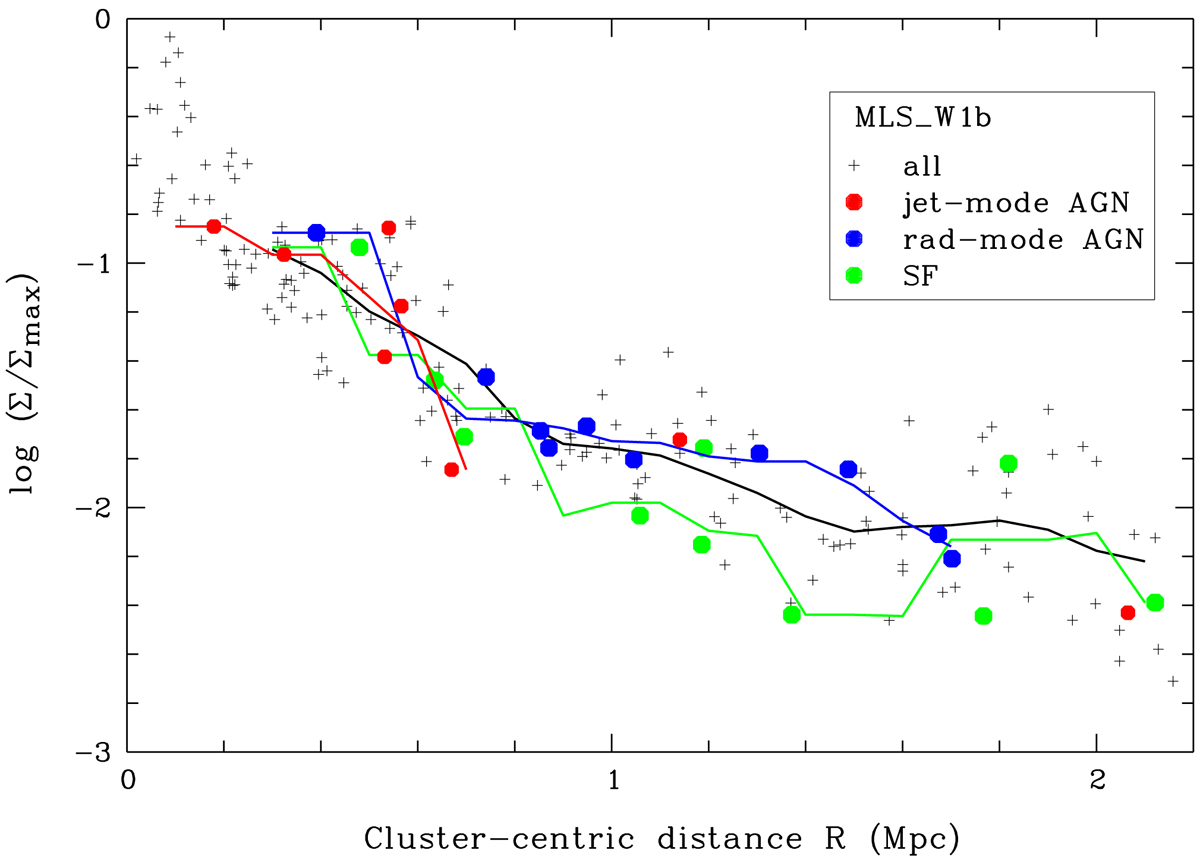
Normalised local density parameter Σ as a function of the cluster-centric distance for the two AGN types and the SF sample. The MLS_W1b sample is plotted for comparison. Symbols indicate individual galaxies, polygons the mean relations for the sub-samples.
Current usage metrics show cumulative count of Article Views (full-text article views including HTML views, PDF and ePub downloads, according to the available data) and Abstracts Views on Vision4Press platform.
Data correspond to usage on the plateform after 2015. The current usage metrics is available 48-96 hours after online publication and is updated daily on week days.
Initial download of the metrics may take a while.