Free Access
Fig. 32.
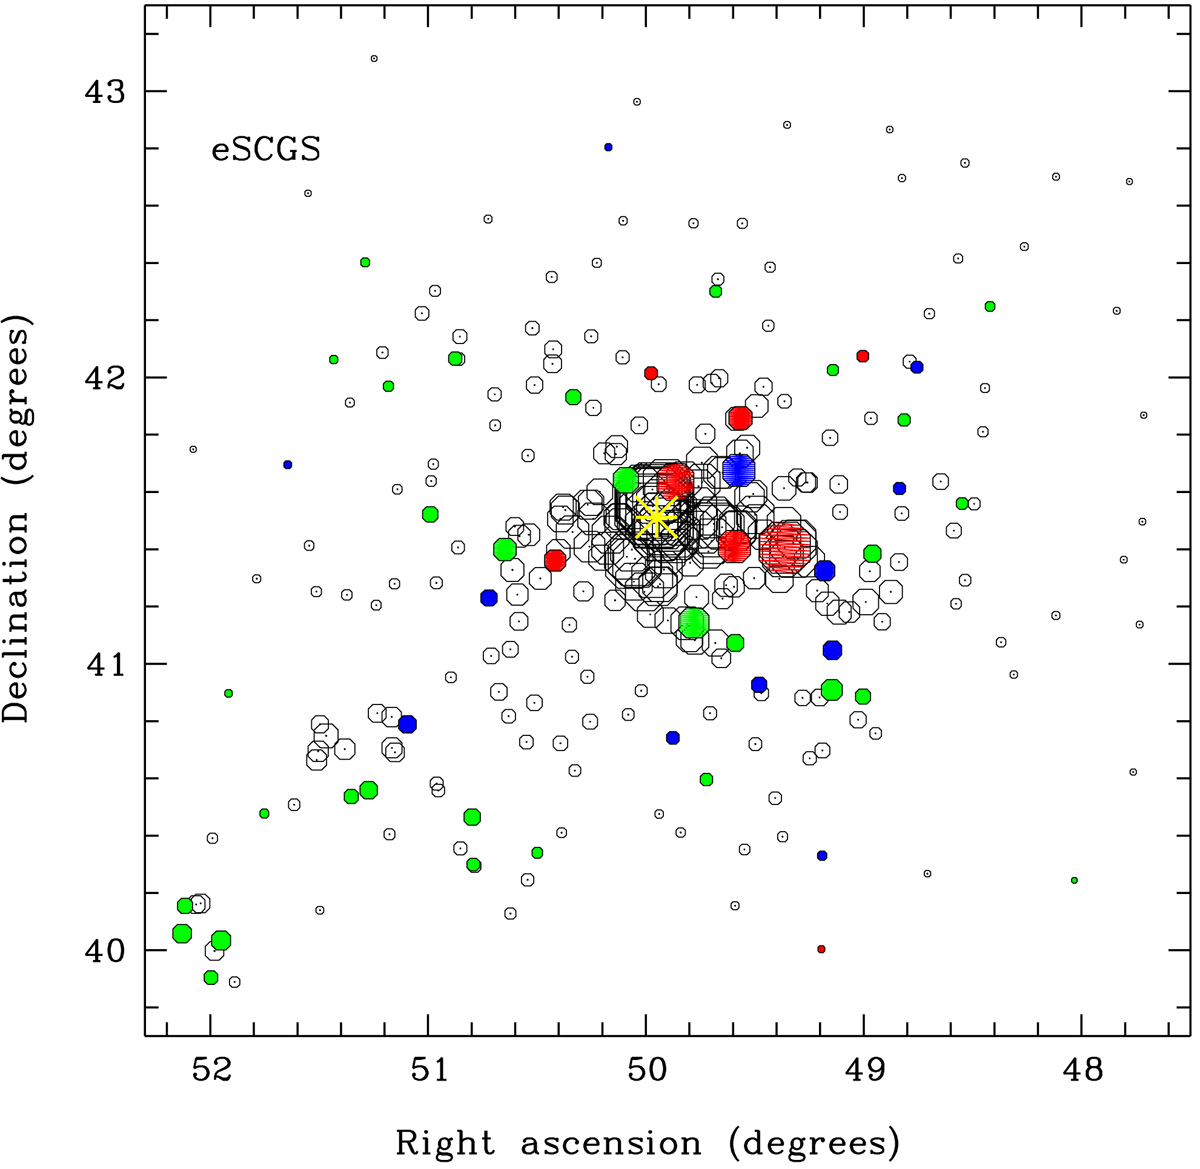
Local density bubble plot diagram for the eSCGS as Fig. 18, but with colour coding for SF galaxies (green), radiative-mode AGN (blue), jet-mode AGN (red). The BCG AGN galaxy NGC 1275 is indicated by the yellow asterisk.
Current usage metrics show cumulative count of Article Views (full-text article views including HTML views, PDF and ePub downloads, according to the available data) and Abstracts Views on Vision4Press platform.
Data correspond to usage on the plateform after 2015. The current usage metrics is available 48-96 hours after online publication and is updated daily on week days.
Initial download of the metrics may take a while.