Fig. 30.
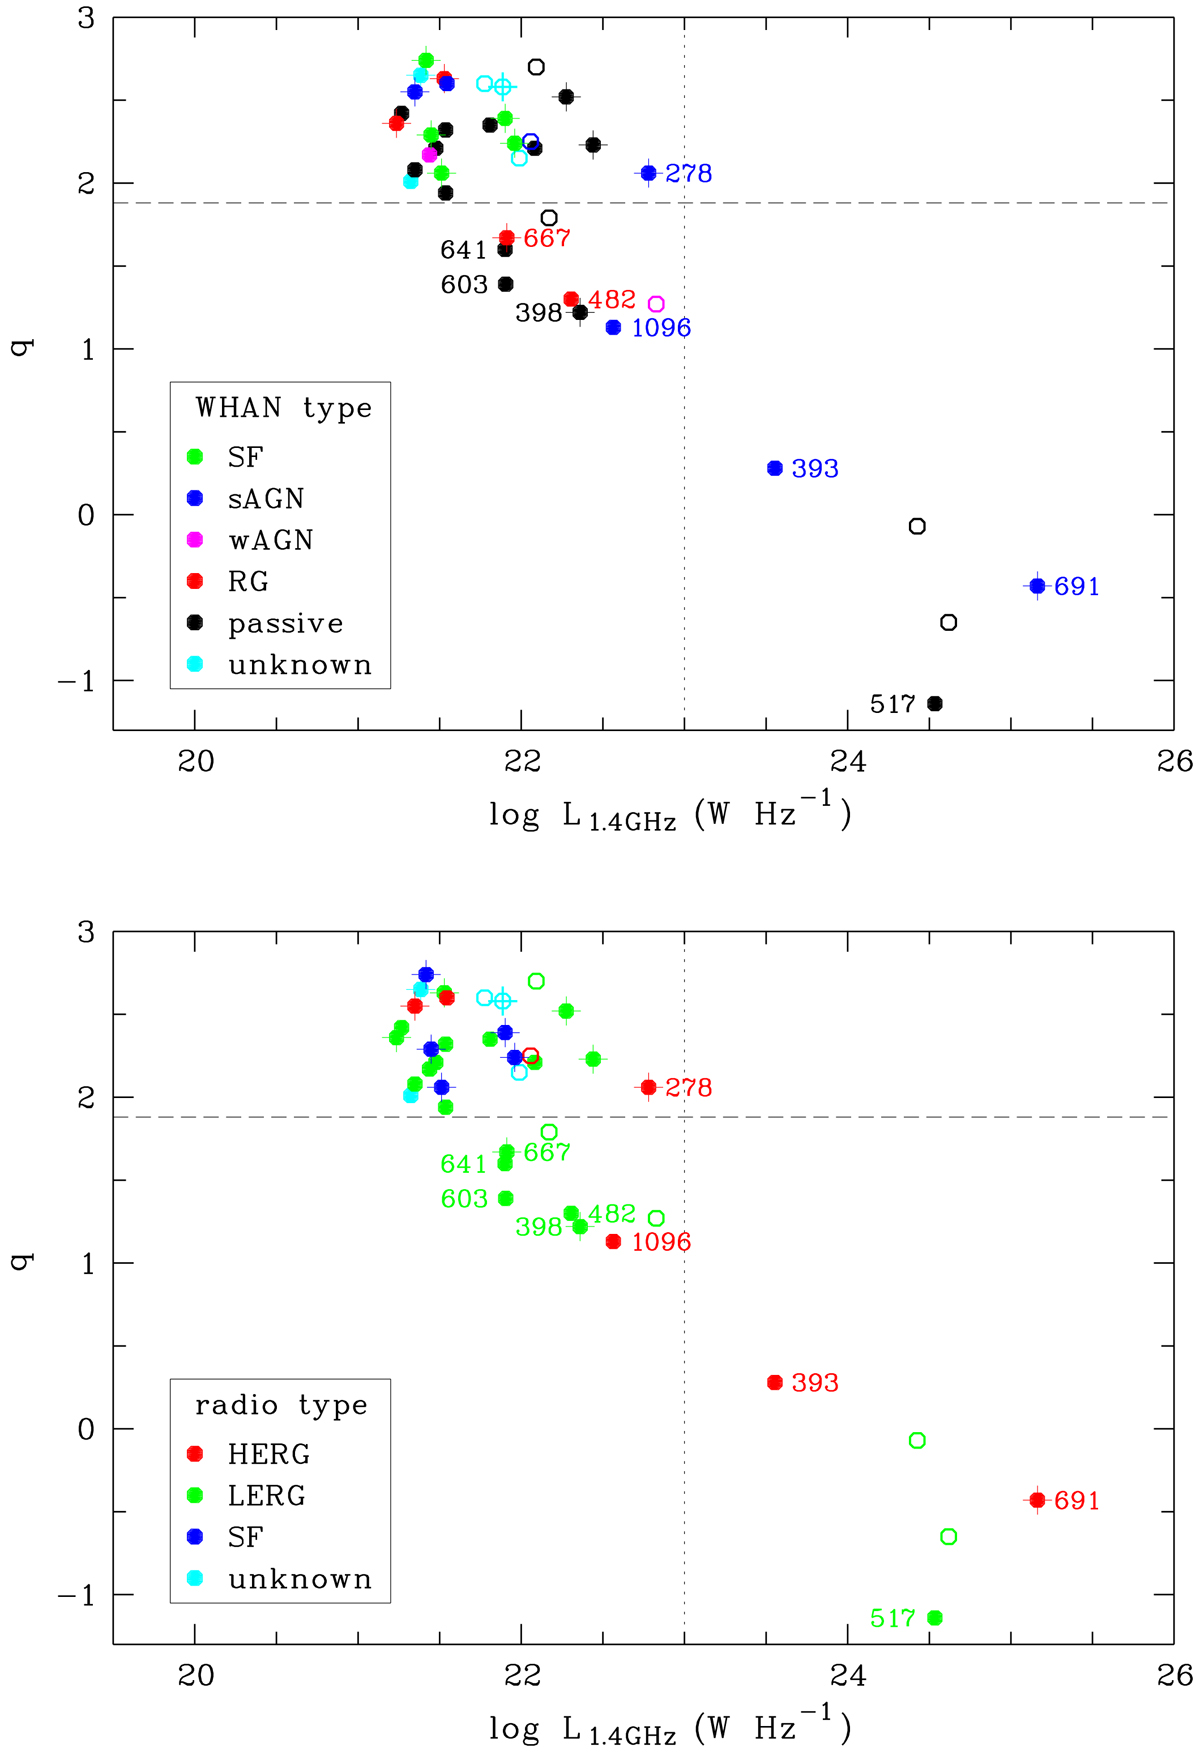
Radio-FIR slope q versus 1.4 GHz radio luminosity for the NVSS sources from Miller & Owen (2001). The colours represent the WHAN type (top) and radio galaxy type (bottom), cluster members are indicated by filled, background galaxies by open circles. Over-plotted plus signs indicate morphological peculiarities. The dotted vertical line represents a (statistical) luminosity threshold for AGN, the dashed horizontal line separates SF galaxies (top) from AGN (bottom). Cluster members outside the “clump” around q = 2.3, log L1.4GHz = 22 are labelled with their catalogue numbers.
Current usage metrics show cumulative count of Article Views (full-text article views including HTML views, PDF and ePub downloads, according to the available data) and Abstracts Views on Vision4Press platform.
Data correspond to usage on the plateform after 2015. The current usage metrics is available 48-96 hours after online publication and is updated daily on week days.
Initial download of the metrics may take a while.