Free Access
Fig. 29.
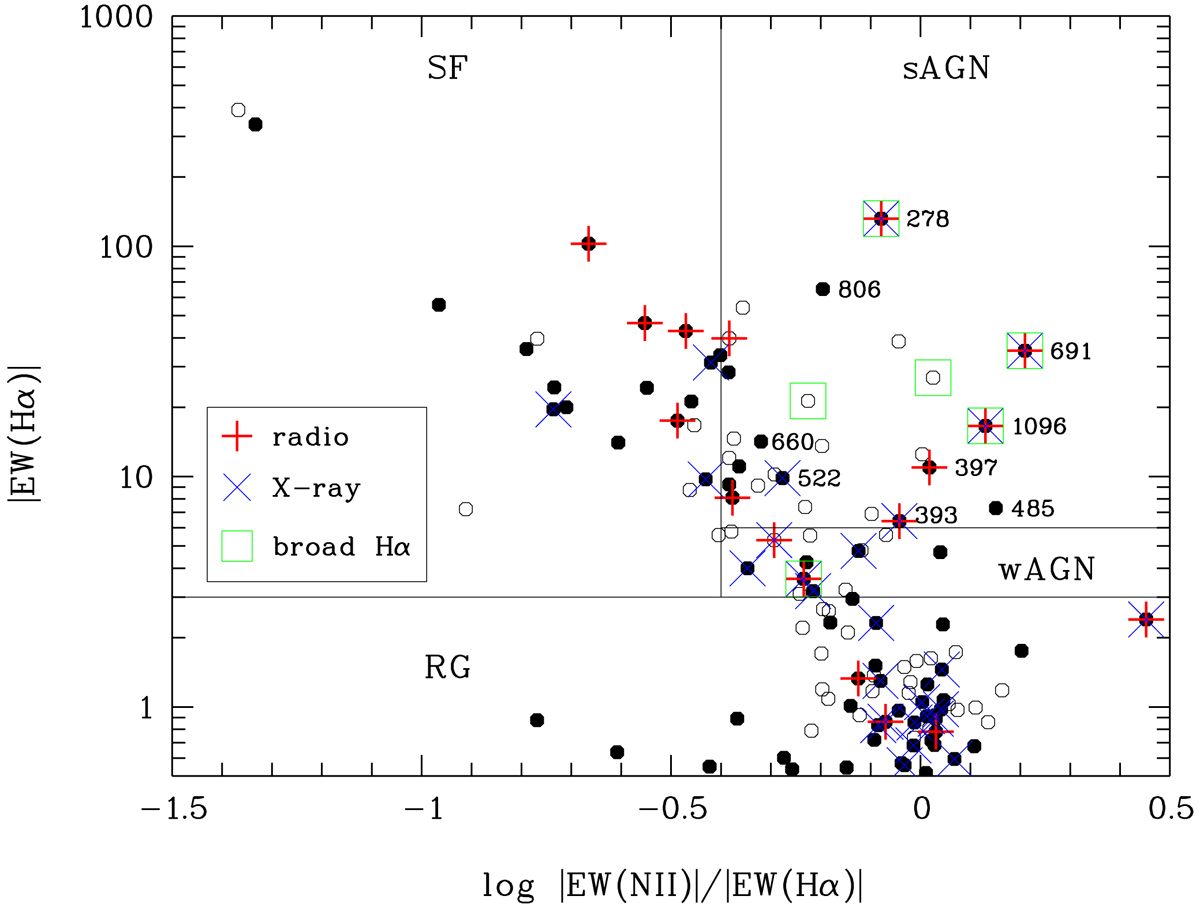
Same as Fig. 25, but with additional symbols to indicate the presence of a broad Hα line component (green open square), an XMM X-ray source (blue cross), or a radio source from Miller & Owen (2001) (red plus sign). Some cluster members in the sAGN area are labelled with their catalogue numbers.
Current usage metrics show cumulative count of Article Views (full-text article views including HTML views, PDF and ePub downloads, according to the available data) and Abstracts Views on Vision4Press platform.
Data correspond to usage on the plateform after 2015. The current usage metrics is available 48-96 hours after online publication and is updated daily on week days.
Initial download of the metrics may take a while.