Free Access
Fig. 28.
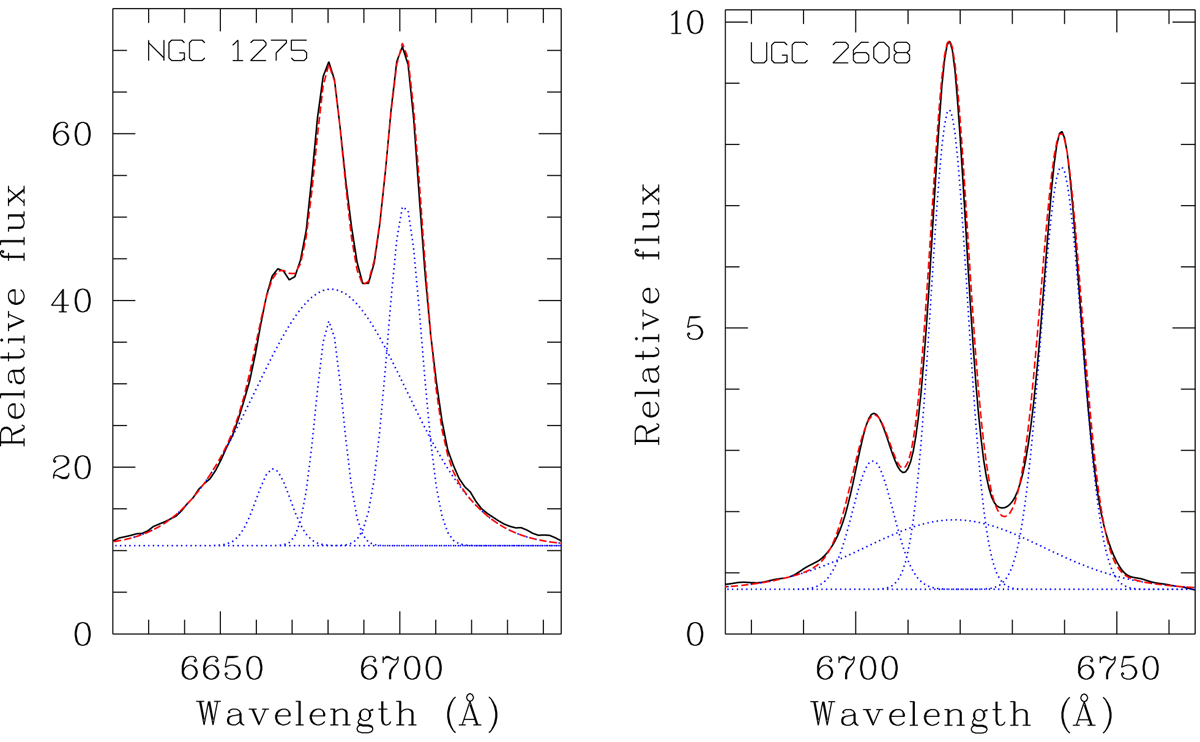
Examples of Gaussian fits of the blended lines Hα+[N II] 6548,6584 for NGC 1275 (left) and UGC 2608 (right). Three narrow and one broad Gaussian components are used (dotted blue curves). The slightly smoothed observed spectrum is shown in black, the sum of the four components is in red.
Current usage metrics show cumulative count of Article Views (full-text article views including HTML views, PDF and ePub downloads, according to the available data) and Abstracts Views on Vision4Press platform.
Data correspond to usage on the plateform after 2015. The current usage metrics is available 48-96 hours after online publication and is updated daily on week days.
Initial download of the metrics may take a while.