Fig. 26.
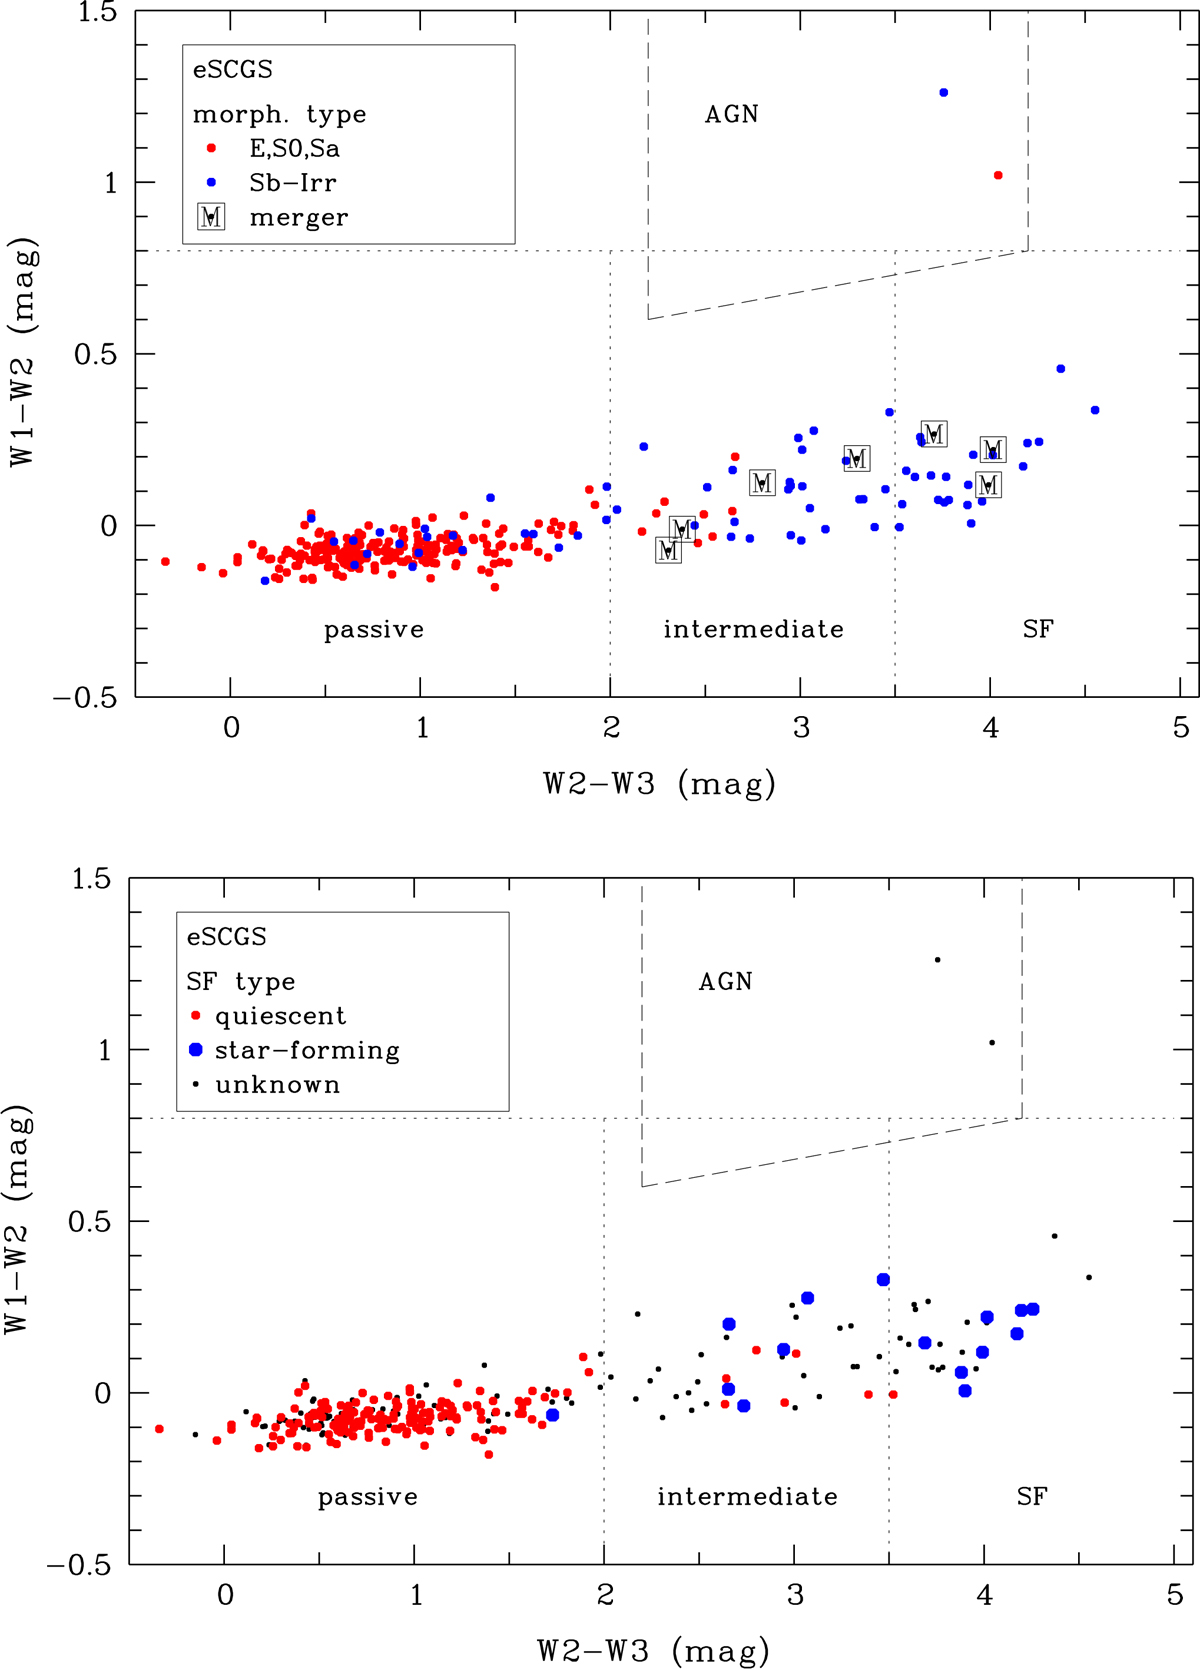
WISE colour-colour diagram for the eSCGS galaxies. Different colours illustrate how galaxies separate by morphological type (top) and SF activity type (bottom) as given in each panel. The dotted vertical demarcation lines are from Jarrett et al. (2017), the horizontal line marks the AGN threshold from Stern et al. (2012). The area indicated by the dashed lines is the AGN wedge from Jarrett et al. (2011).
Current usage metrics show cumulative count of Article Views (full-text article views including HTML views, PDF and ePub downloads, according to the available data) and Abstracts Views on Vision4Press platform.
Data correspond to usage on the plateform after 2015. The current usage metrics is available 48-96 hours after online publication and is updated daily on week days.
Initial download of the metrics may take a while.