Fig. 21.
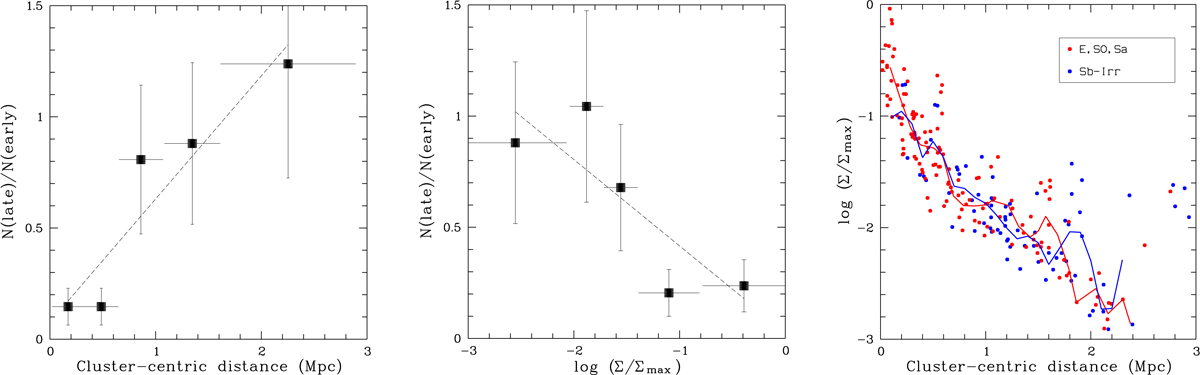
Radial segregation in the eSCGS: number ratio of late-type to early-type galaxies. Left and middle panels: binned data where each bin contains roughly the same fraction of galaxies from the parent sample. Symbols are mean values, horizontal bars indicate the bin width, vertical bars the Poissonian errors per bin. The right panel displays the corresponding Σ − R diagram where the polygons are the mean relations.
Current usage metrics show cumulative count of Article Views (full-text article views including HTML views, PDF and ePub downloads, according to the available data) and Abstracts Views on Vision4Press platform.
Data correspond to usage on the plateform after 2015. The current usage metrics is available 48-96 hours after online publication and is updated daily on week days.
Initial download of the metrics may take a while.