Fig. 20.
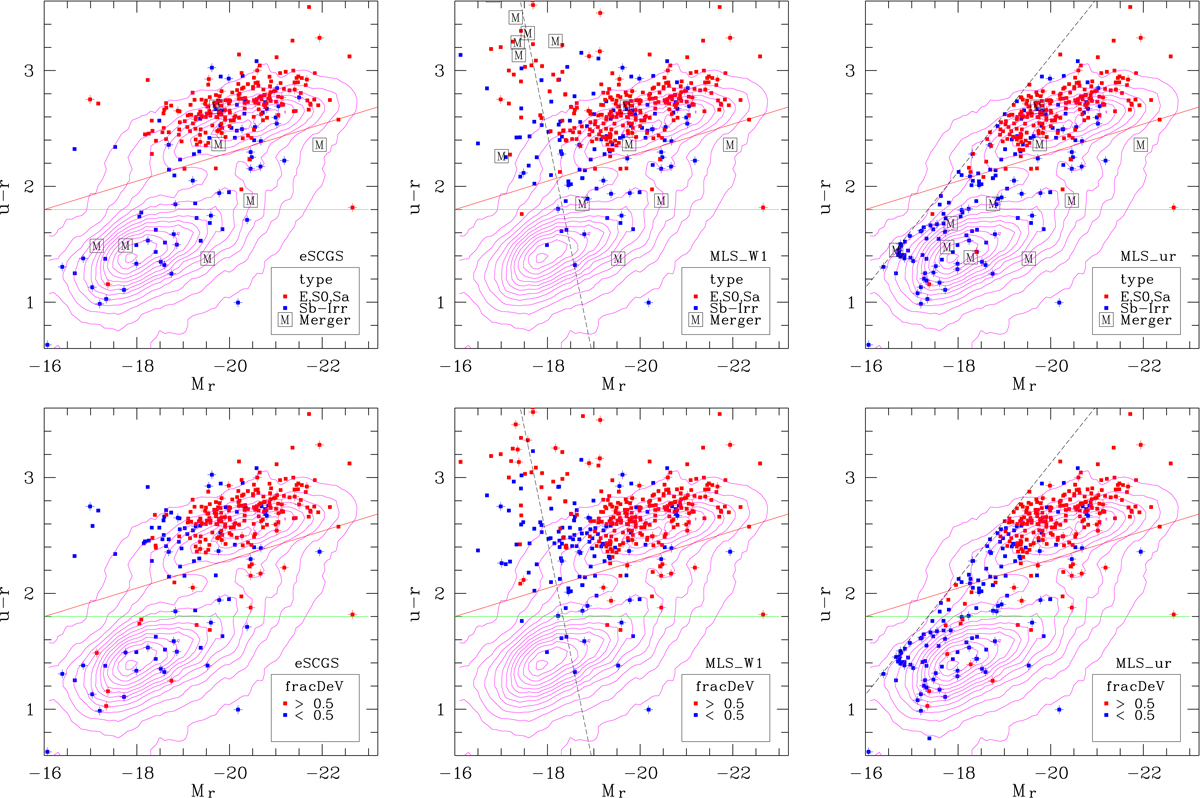
Colour magnitude diagrams for the samples eSCGS, MLS_ur, and MLS_W1 (left to right). Different colours indicate morphological types (top) or the fracDeV type (bottom). Morphological peculiarities are indicated by an overplottet plus sign, a framed “M” (top raw) indicates a merger system. The dashed lines mark the approximate border of the colour selection area for the magnitude-limited samples (see text). The magenta contours show the population density of nearby galaxies from SDSS. The solid lines mark the transition between red sequence and green valley (red) and green valley and blue cloud (green).
Current usage metrics show cumulative count of Article Views (full-text article views including HTML views, PDF and ePub downloads, according to the available data) and Abstracts Views on Vision4Press platform.
Data correspond to usage on the plateform after 2015. The current usage metrics is available 48-96 hours after online publication and is updated daily on week days.
Initial download of the metrics may take a while.