Free Access
Fig. 19.
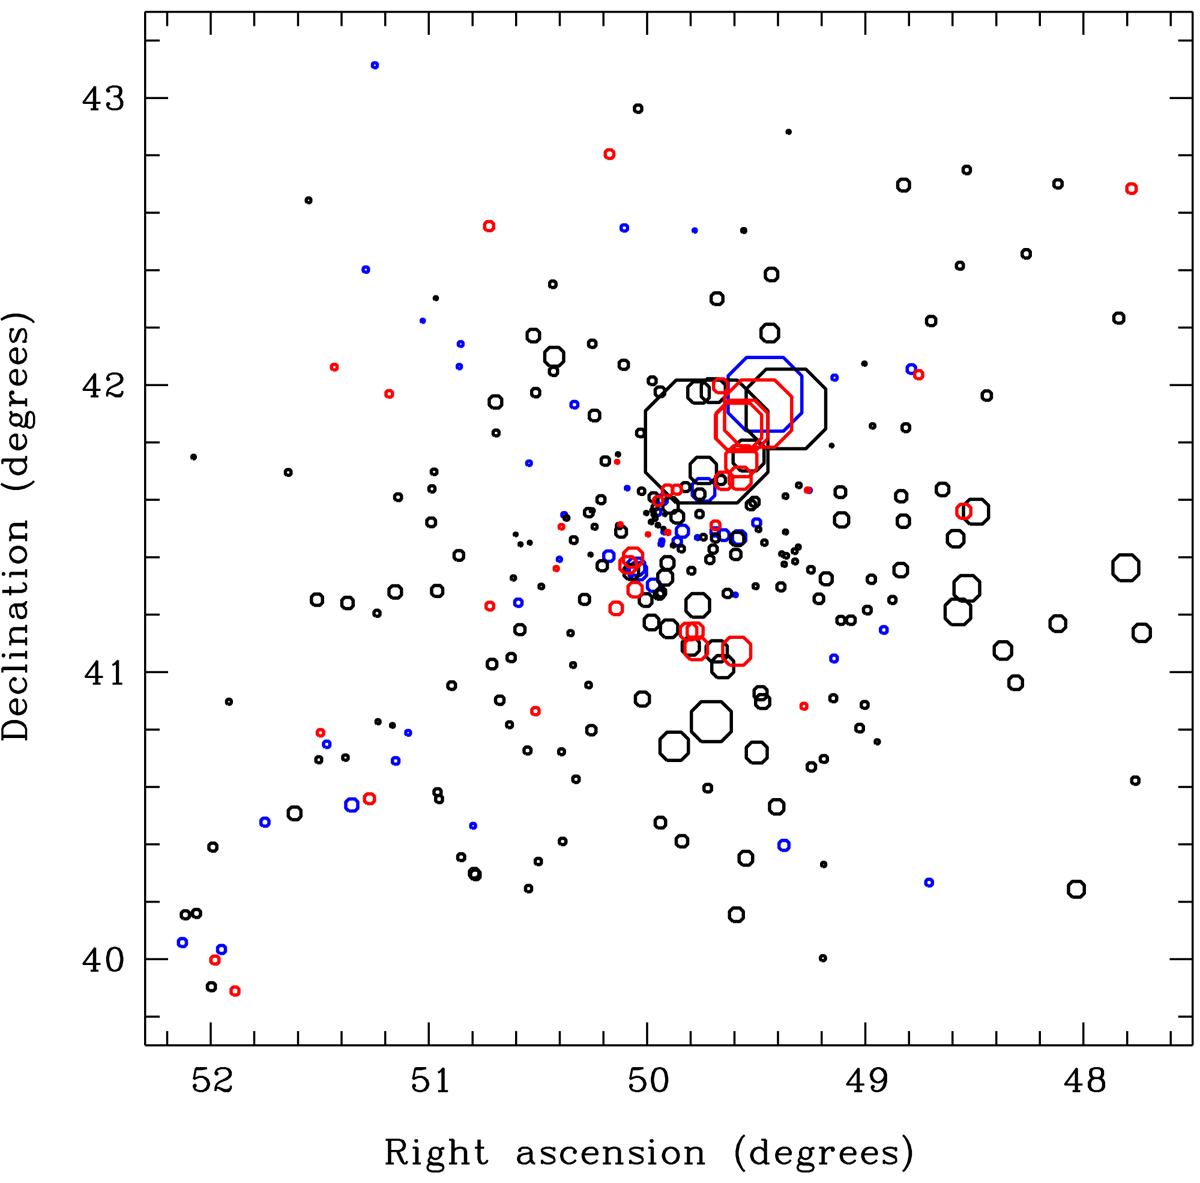
Bubble plot diagram for the DS test. Galaxies are plotted by hexagons whose size is proportional to the test statistic δ on an exponential scale where the colours represent different intervals of relative velocities (see text).
Current usage metrics show cumulative count of Article Views (full-text article views including HTML views, PDF and ePub downloads, according to the available data) and Abstracts Views on Vision4Press platform.
Data correspond to usage on the plateform after 2015. The current usage metrics is available 48-96 hours after online publication and is updated daily on week days.
Initial download of the metrics may take a while.