Fig. 16.
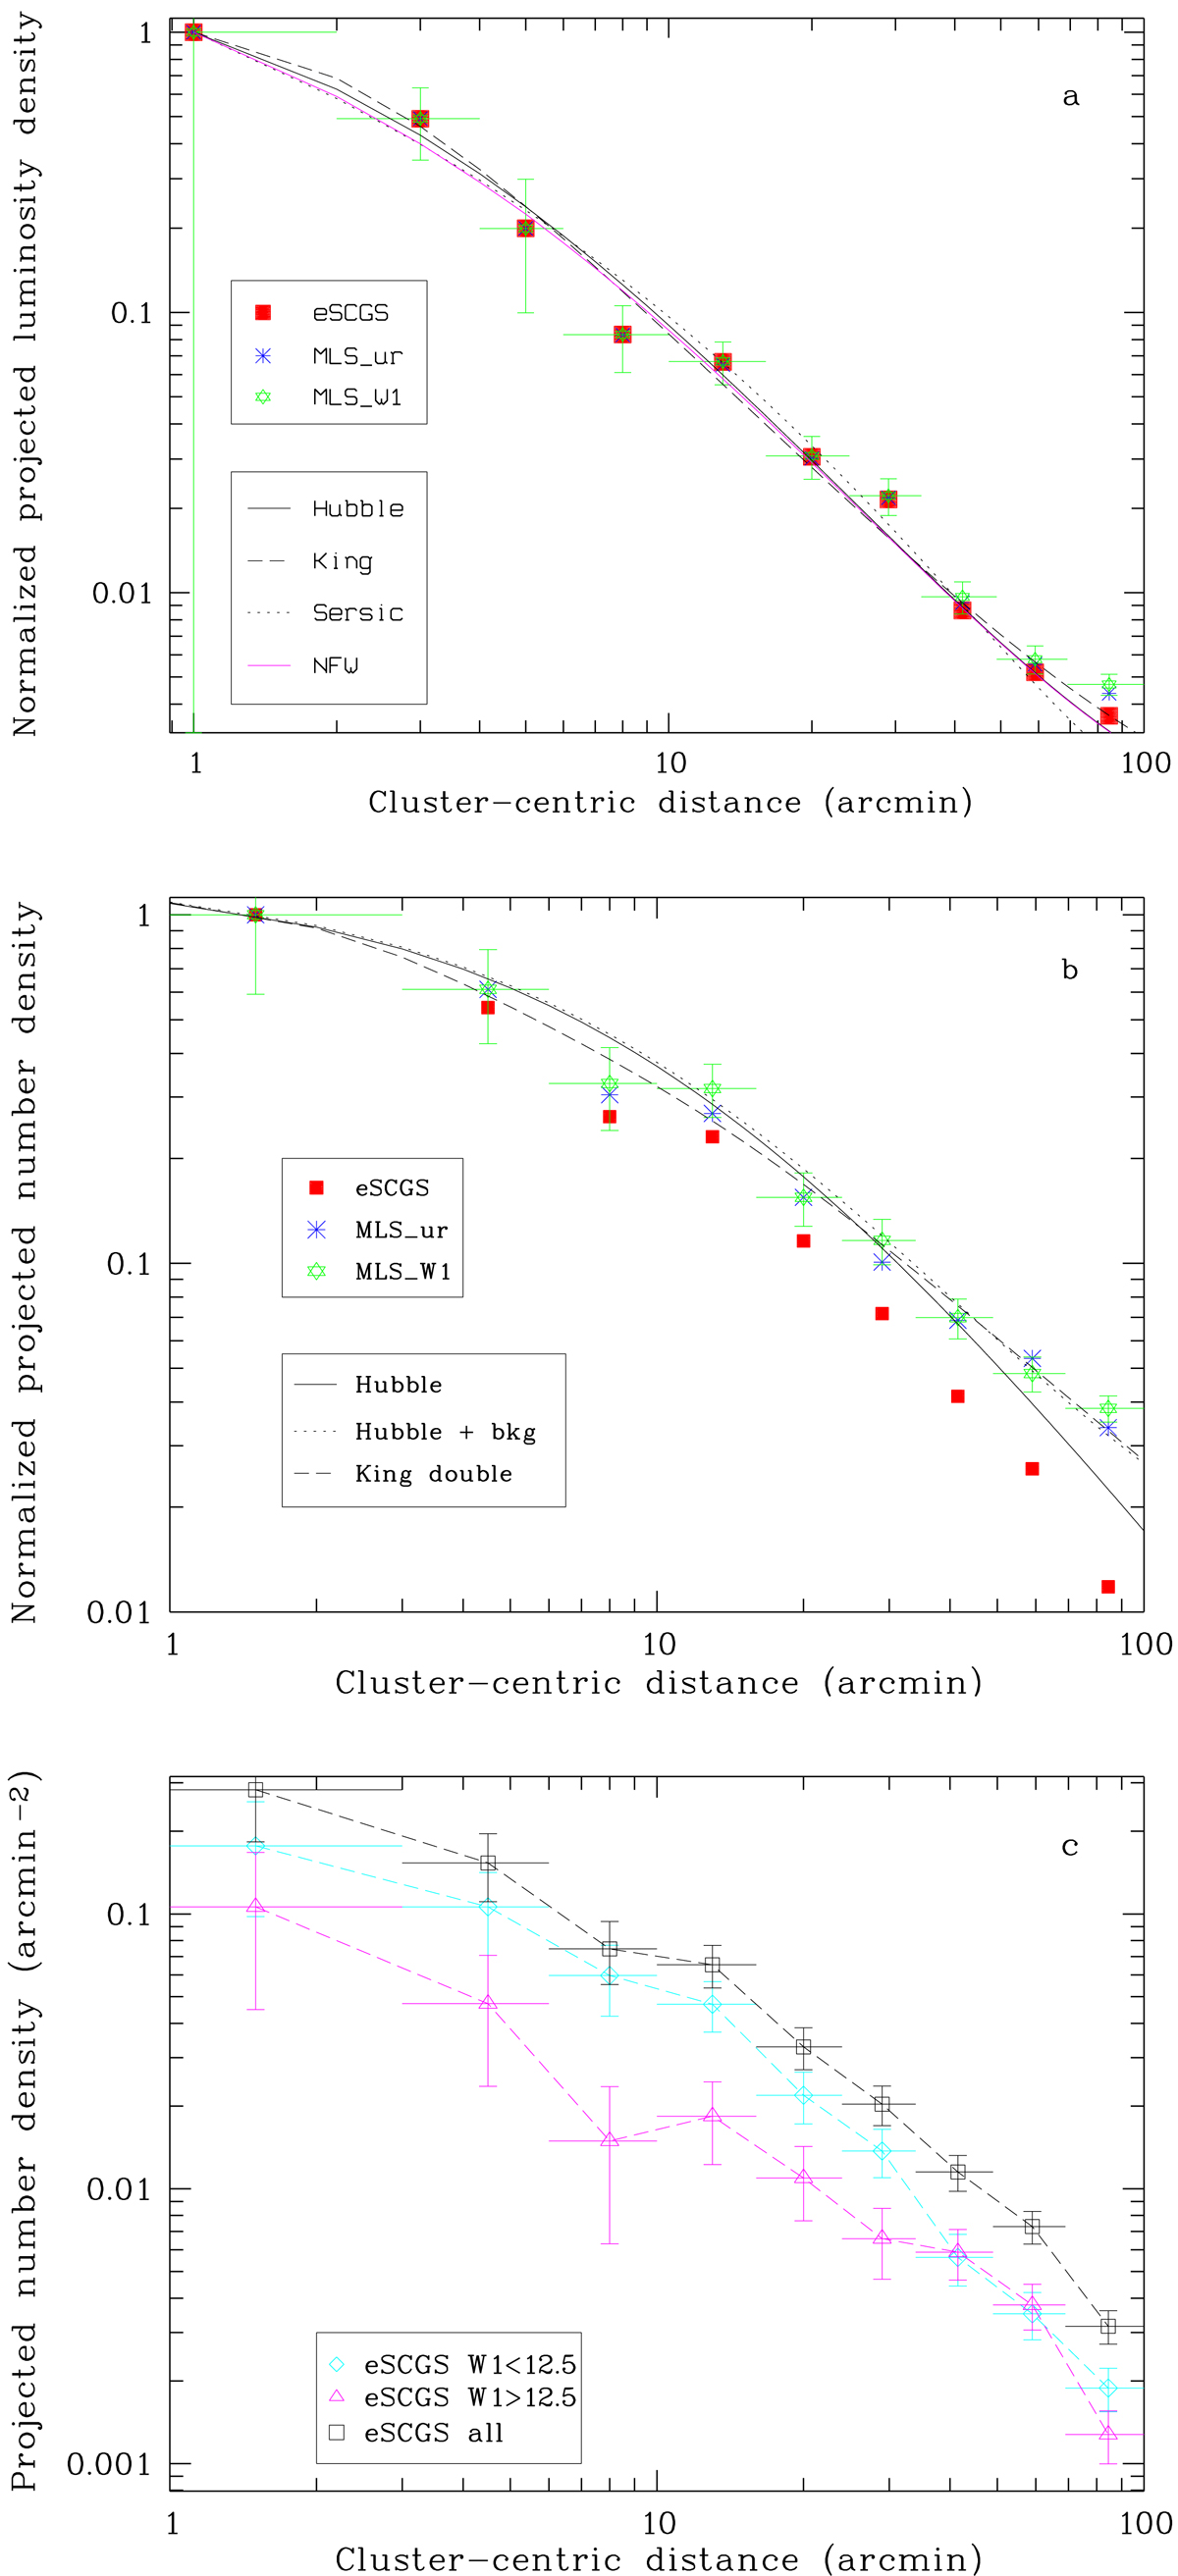
Radial projected profiles for the K-band surface brightness (a) and the number densities (b and c). Bars indicate formal statistical errors (vertical) and binning intervals (horizontal). The curves in panel a are for the model parameters from Table 3. Panel b: the Hubble model is for (Rc, β, Σb) = (10′,0.9, 0), the dotted curve includes a background fraction fb = 0.15. The dashed curve is a double-King profile with (Rc, 1, β1, Rc, 2, β2) = (3′,1, 10′,0.58) and Σb = 0. Panel c: the symbols are interconnected by dashed lines just to guide the eye.
Current usage metrics show cumulative count of Article Views (full-text article views including HTML views, PDF and ePub downloads, according to the available data) and Abstracts Views on Vision4Press platform.
Data correspond to usage on the plateform after 2015. The current usage metrics is available 48-96 hours after online publication and is updated daily on week days.
Initial download of the metrics may take a while.