Fig. 13.
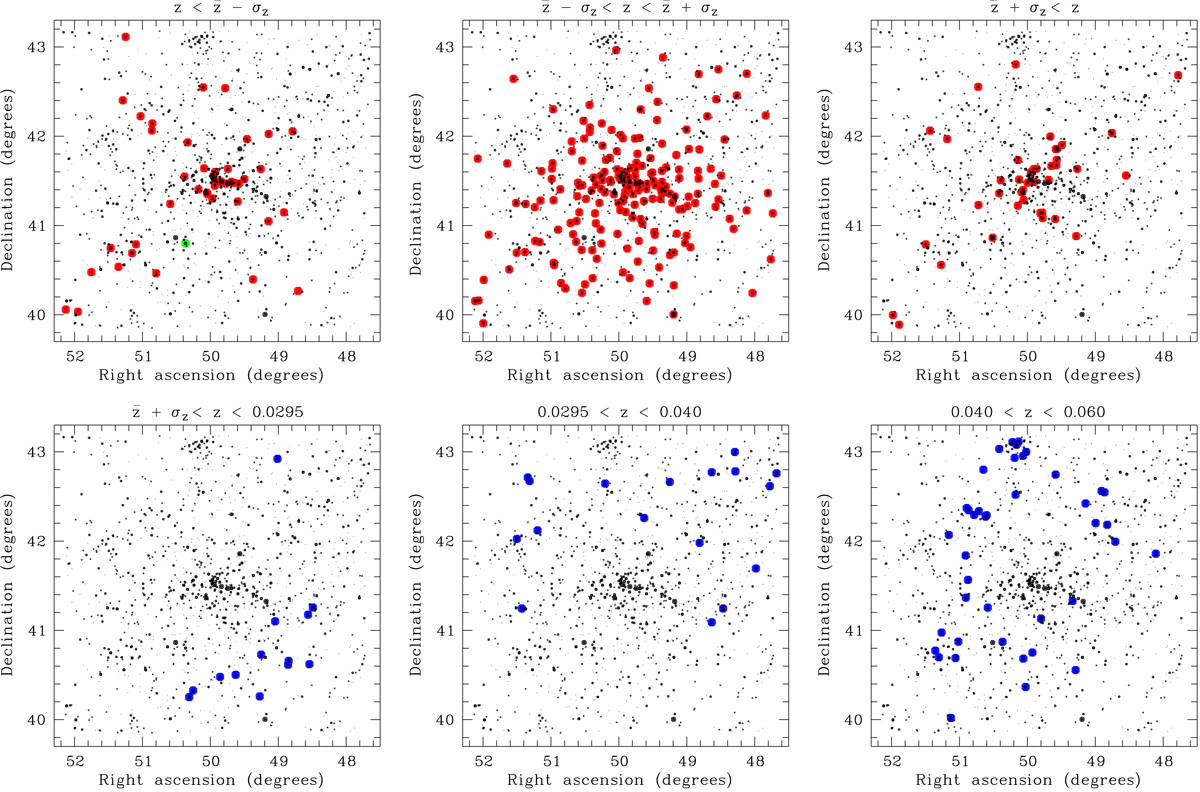
Sky map of all catalogued galaxies (black). The galaxies with known redshifts are indicated by larger coloured dots in six different z intervals. The redshift intervals are indicated at the top of each panel, where ![]() and σz are the mean and the standard deviation, respectively, of the redshifts for the spectroscopic cluster members (Table 2). Top row: the colours highlight the cluster members (red) and the one foreground galaxy (green). Bottom row: background galaxies are labeled blue.
and σz are the mean and the standard deviation, respectively, of the redshifts for the spectroscopic cluster members (Table 2). Top row: the colours highlight the cluster members (red) and the one foreground galaxy (green). Bottom row: background galaxies are labeled blue.
Current usage metrics show cumulative count of Article Views (full-text article views including HTML views, PDF and ePub downloads, according to the available data) and Abstracts Views on Vision4Press platform.
Data correspond to usage on the plateform after 2015. The current usage metrics is available 48-96 hours after online publication and is updated daily on week days.
Initial download of the metrics may take a while.