Fig. 7.
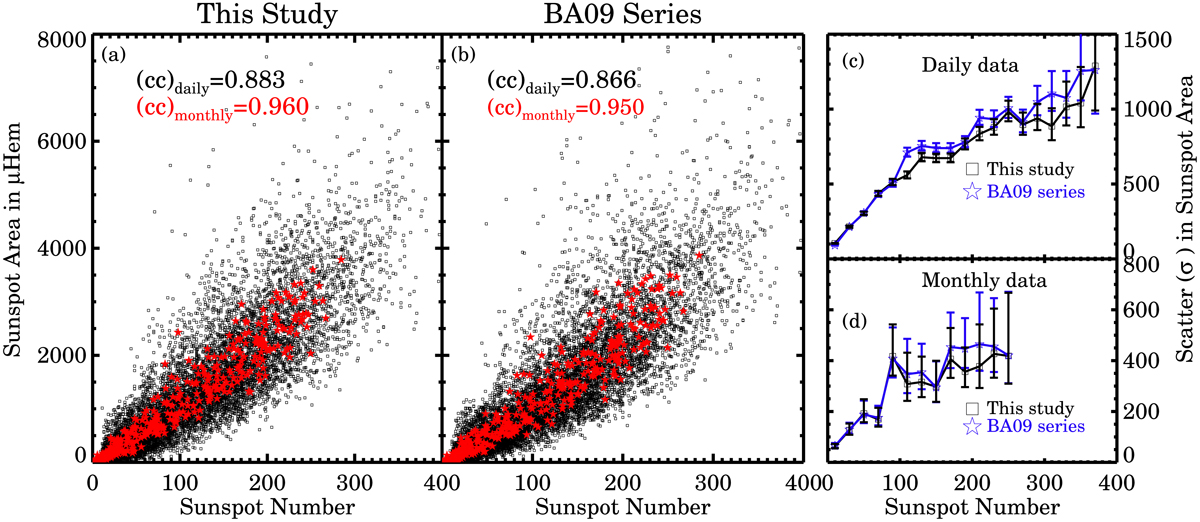
Panel a: scatter diagram between daily (monthly) sunspot number and daily (monthly) sunspot areas from this work, in black (red). Panelb: same but for the areas from the BA09 series. The relevant correlation coefficients (cc) are printed in the respective panels. Panels c and d: binned values of scatter (σ) in sunspot areas (this work in black and BA09 series in blue) vs. sunspot number (binned values of 20) for the daily and monthly data, respectively. Error-bars represent the 90% confidence intervals of σ.
Current usage metrics show cumulative count of Article Views (full-text article views including HTML views, PDF and ePub downloads, according to the available data) and Abstracts Views on Vision4Press platform.
Data correspond to usage on the plateform after 2015. The current usage metrics is available 48-96 hours after online publication and is updated daily on week days.
Initial download of the metrics may take a while.