Fig. 4.
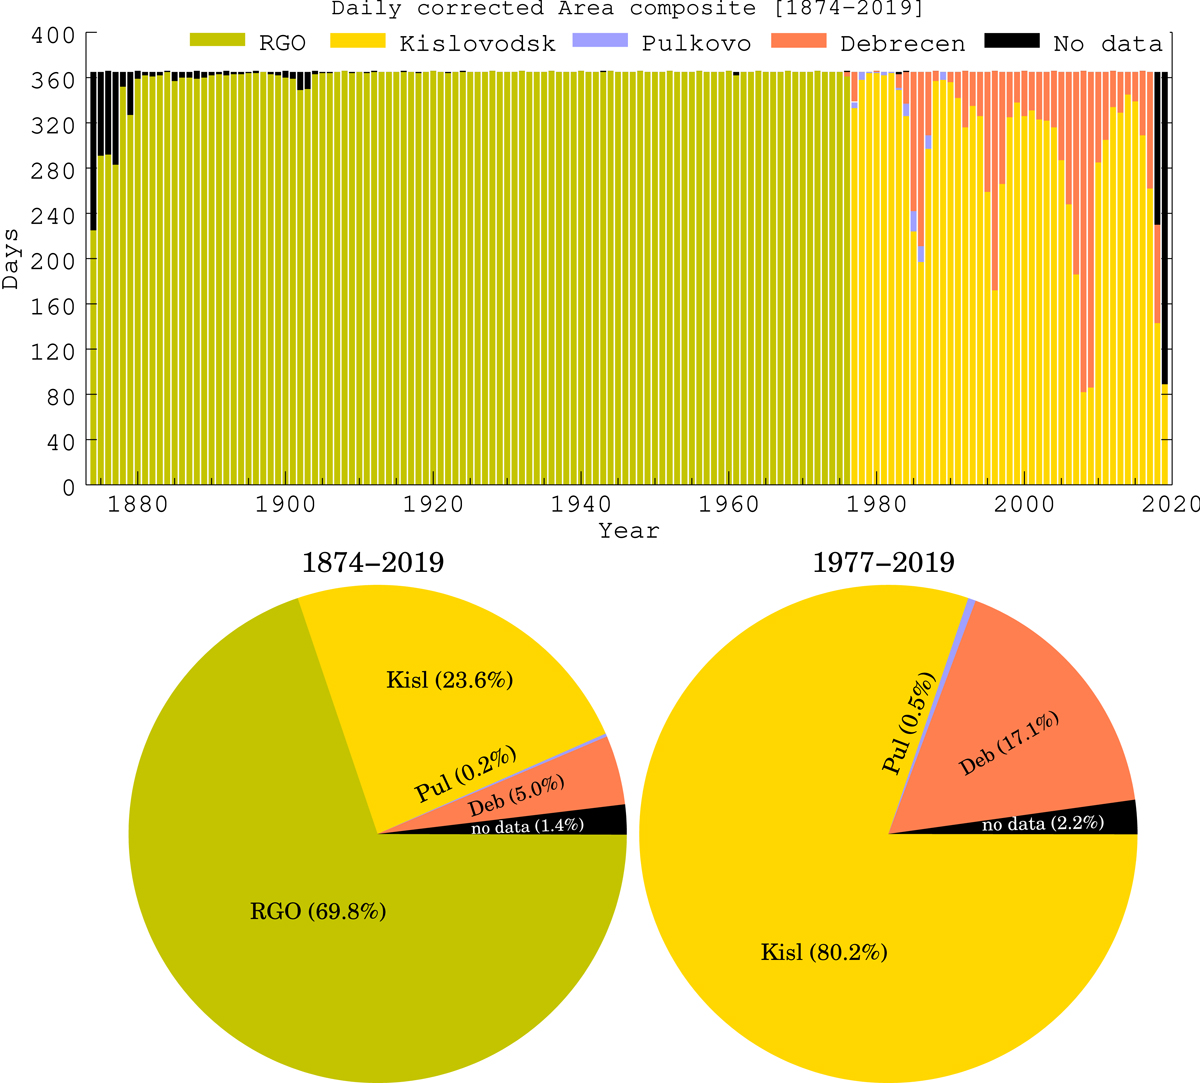
Top panel: overview of the structure and the coverage of the final composite of the corrected sunspot areas. Different colours (see legend at the top) show data from different observatories. Y-axis is the number of days per year, for which data are available. Bottom panel: pie-charts highlighting the percentage of contributions of observatories to the complete calibrated series (1874–2019: left chart) and only to the post-RGO period (1977–2019: right chart).
Current usage metrics show cumulative count of Article Views (full-text article views including HTML views, PDF and ePub downloads, according to the available data) and Abstracts Views on Vision4Press platform.
Data correspond to usage on the plateform after 2015. The current usage metrics is available 48-96 hours after online publication and is updated daily on week days.
Initial download of the metrics may take a while.