Open Access
Fig. C.1.
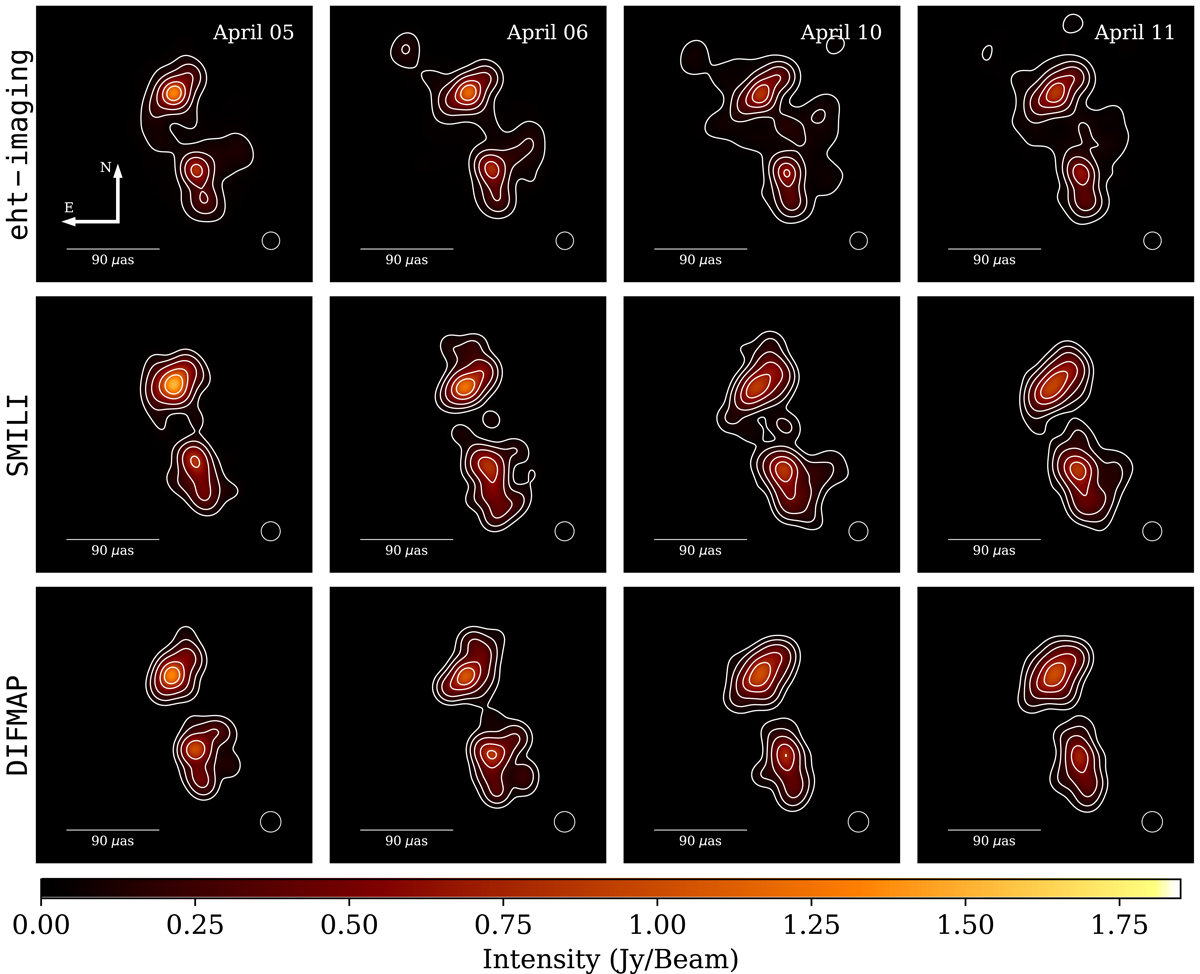
Same as Fig. 4, but for all imaging methods before the averaging. Each row and column corresponds to different imaging pipelines (eht-imaging, SMILI, and Difmap) and observing epochs (April 05, 06, 10, and 11), respectively. We note that these images are not yet aligned with each other.
Current usage metrics show cumulative count of Article Views (full-text article views including HTML views, PDF and ePub downloads, according to the available data) and Abstracts Views on Vision4Press platform.
Data correspond to usage on the plateform after 2015. The current usage metrics is available 48-96 hours after online publication and is updated daily on week days.
Initial download of the metrics may take a while.