Fig. 6.
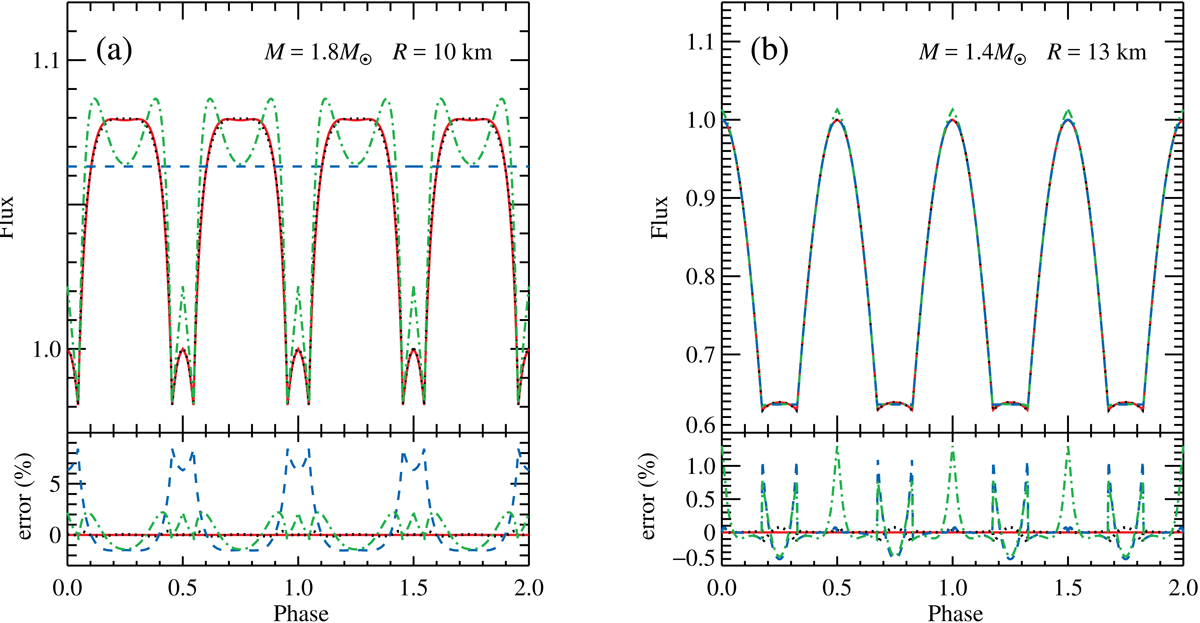
Upper panels: scaled flux as a function of the pulsar phase produced by two antipodal hotspots at the NS surface for two different compactnesses: (a) M = 1.8 M⊙, R = 10 km; (b) M = 1.4 M⊙, R = 13 km. Both the observer inclination and the magnetic obliquity are fixed at 90°. The red solid curves give the results for the exact calculations of bending. Our approximation (given by Eqs. (2) and (17)) is shown with black dotted curves. The blue dashed and green dot-dashed curves correspond to the approximations by Beloborodov (2002) and La Placa et al. (2019), respectively. Lower panels: relative error in the flux for the same three approximations of light bending compared to the exact result.
Current usage metrics show cumulative count of Article Views (full-text article views including HTML views, PDF and ePub downloads, according to the available data) and Abstracts Views on Vision4Press platform.
Data correspond to usage on the plateform after 2015. The current usage metrics is available 48-96 hours after online publication and is updated daily on week days.
Initial download of the metrics may take a while.