Fig. 3.
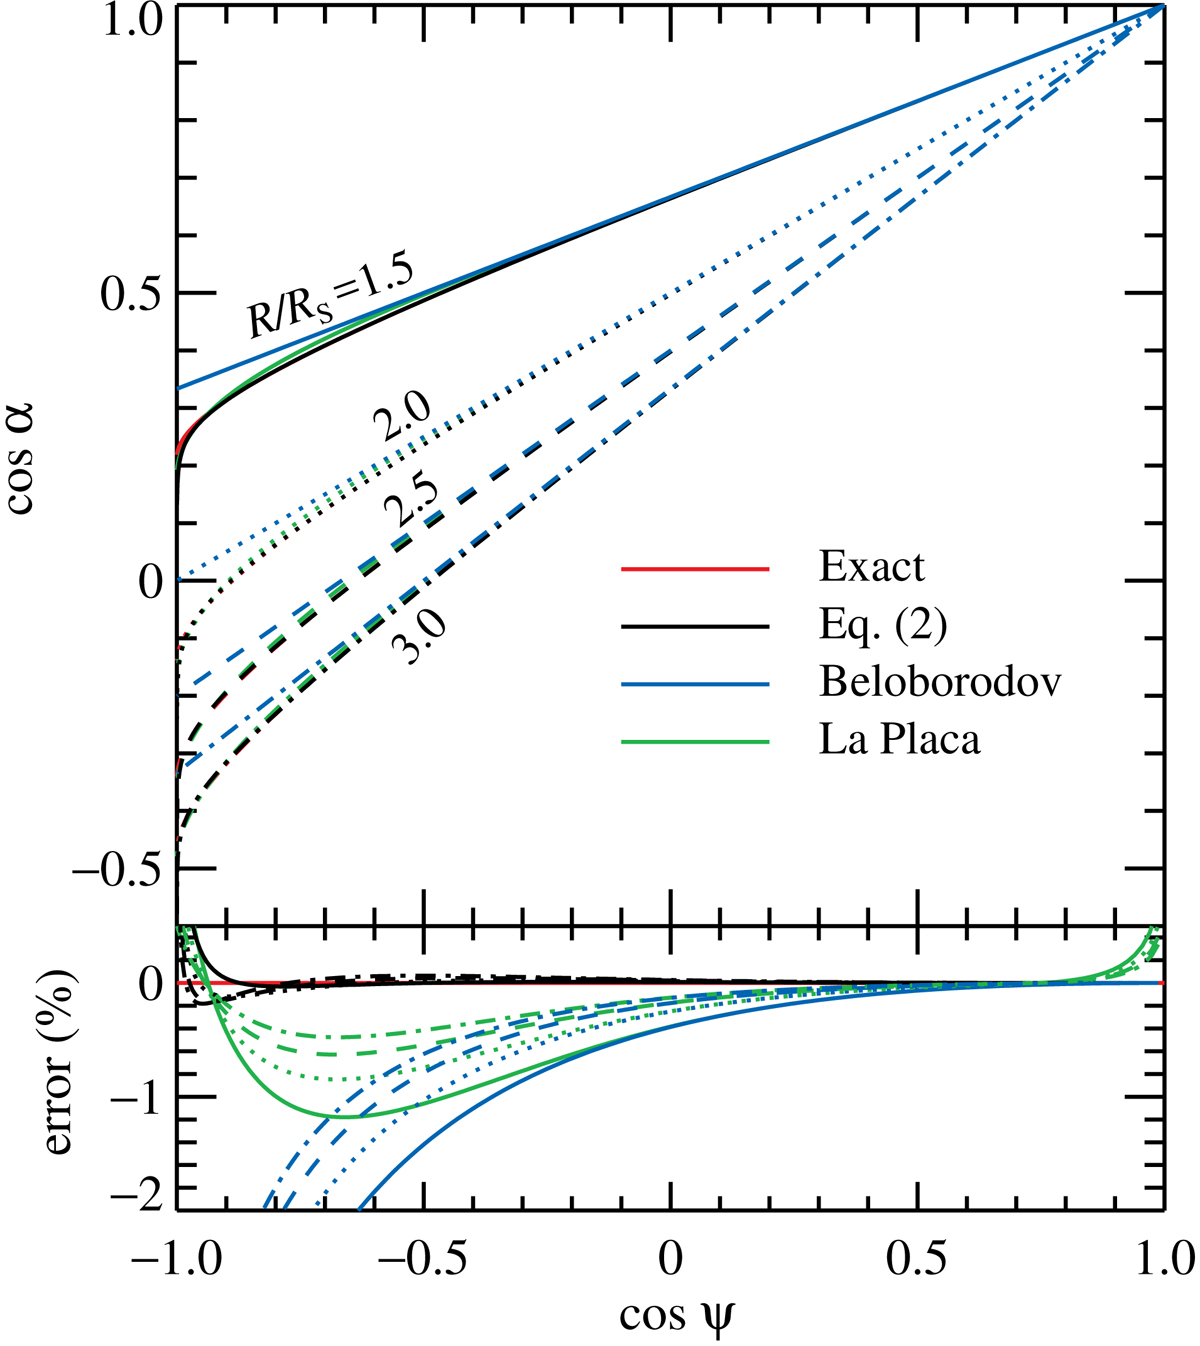
Upper panel: light bending relation between the cosine of the emission angle α and the cosine of the angle ψ between the line of sight and the radius-vector of the emission point in the Schwarzschild metric. The red curves give the exact relation. Our new approximate relation (2) is shown with the black curves. The blue straight lines are for the Beloborodov (2002) approximation (1), while the green curves represent the approximation (16) by La Placa et al. (2019). The red, green, and black curves practically coincide. The solid, dotted, dashed, and dot-dashed curves correspond to radii R/RS = 1.5, 2, 2.5, and 3, respectively. Bottom panel: relative error of the emission angle δα/α for three approximations as compared to the exact result. Same notations as in the upper panel.
Current usage metrics show cumulative count of Article Views (full-text article views including HTML views, PDF and ePub downloads, according to the available data) and Abstracts Views on Vision4Press platform.
Data correspond to usage on the plateform after 2015. The current usage metrics is available 48-96 hours after online publication and is updated daily on week days.
Initial download of the metrics may take a while.