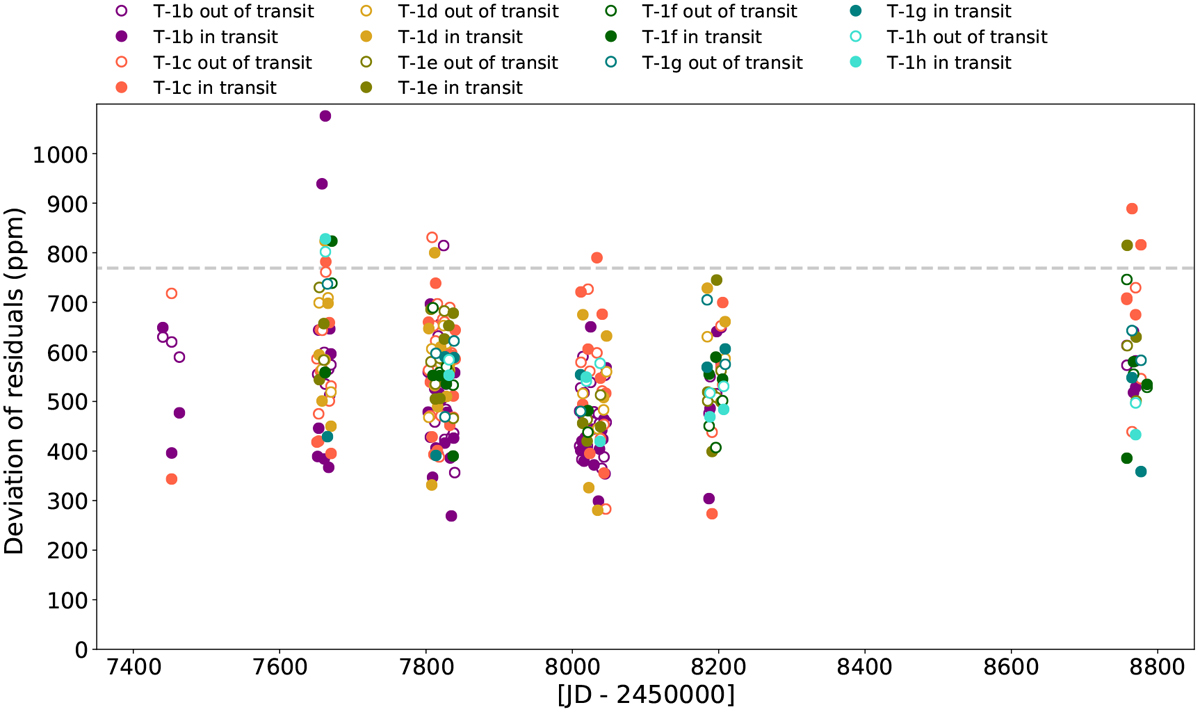
Fig. 7

Standard deviation of the residuals (ppm) in- and out-of-transit for each planet (filled dots for in-transit data, empty dots for out-of-transit) such that for each transit’s epoch there is one empty dot and one filled dot. Each color is associated with a planet: purple for planet b, orange for c, yellow for d, olive for e, dark green for f, teal for g and turquoise for h. The dashed gray line show the limit value above we label the transits as outliers.
Current usage metrics show cumulative count of Article Views (full-text article views including HTML views, PDF and ePub downloads, according to the available data) and Abstracts Views on Vision4Press platform.
Data correspond to usage on the plateform after 2015. The current usage metrics is available 48-96 hours after online publication and is updated daily on week days.
Initial download of the metrics may take a while.


