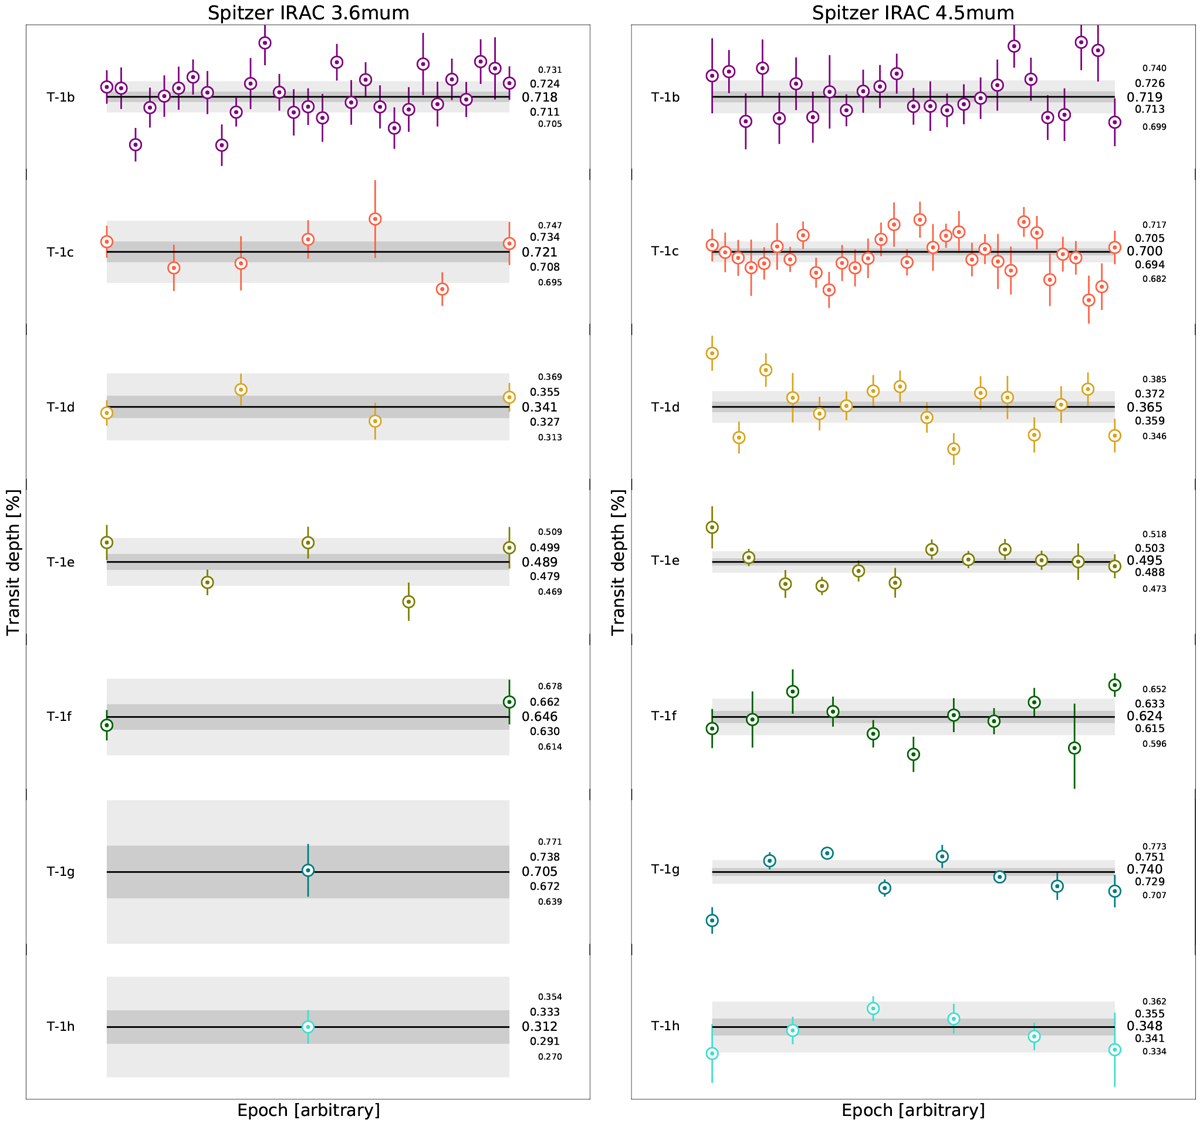
Fig. 5

Left: evolution of the measured transit depths from the planet- per- planet global analyses of transit light curves at 3.6 μm. The horizontal black lines show the medians of the global MCMC posterior PDFs from the planet- per- planet analyses with TTV and no transit depth variations allowed (with their 1-σ and 2-σ confidence intervals (see values in Table 6) in shades of gray). Events are ranked in order of capture, left to right (but not linearly in time). Right: similarly, but for transits observed at 4.5 μm.
Current usage metrics show cumulative count of Article Views (full-text article views including HTML views, PDF and ePub downloads, according to the available data) and Abstracts Views on Vision4Press platform.
Data correspond to usage on the plateform after 2015. The current usage metrics is available 48-96 hours after online publication and is updated daily on week days.
Initial download of the metrics may take a while.


