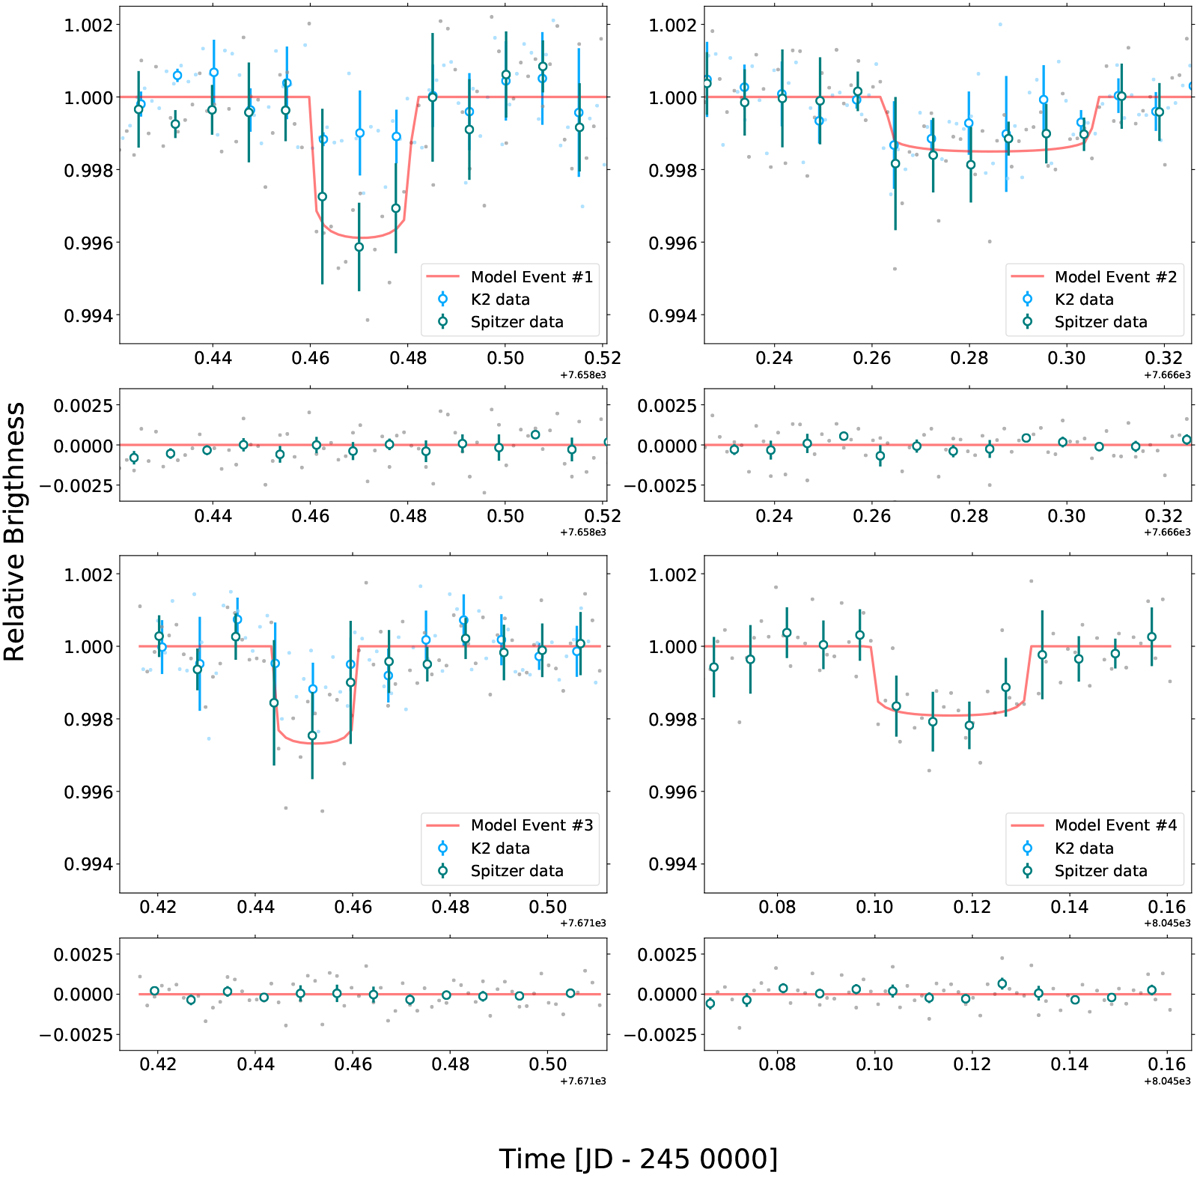
Fig. 21

Visualization of the fits of the light curve of the four transit-like structures found in Spitzer photometry. Gray dots show the unbinned measurements for Spitzer; green open circles depict 10 min-binned measurements for visual clarity. The best-fit transit models are shown as red solid lines. Events are ranked and assigned a number corresponding to their chronological order: Top left: event #1, top right: event #2, bottom left: event #3 and bottom right: event #4. When available K2 simultaneous measurements are over-plotted in blue dots with 10 min-binned measurements as blue open circles.
Current usage metrics show cumulative count of Article Views (full-text article views including HTML views, PDF and ePub downloads, according to the available data) and Abstracts Views on Vision4Press platform.
Data correspond to usage on the plateform after 2015. The current usage metrics is available 48-96 hours after online publication and is updated daily on week days.
Initial download of the metrics may take a while.


