Fig. 2

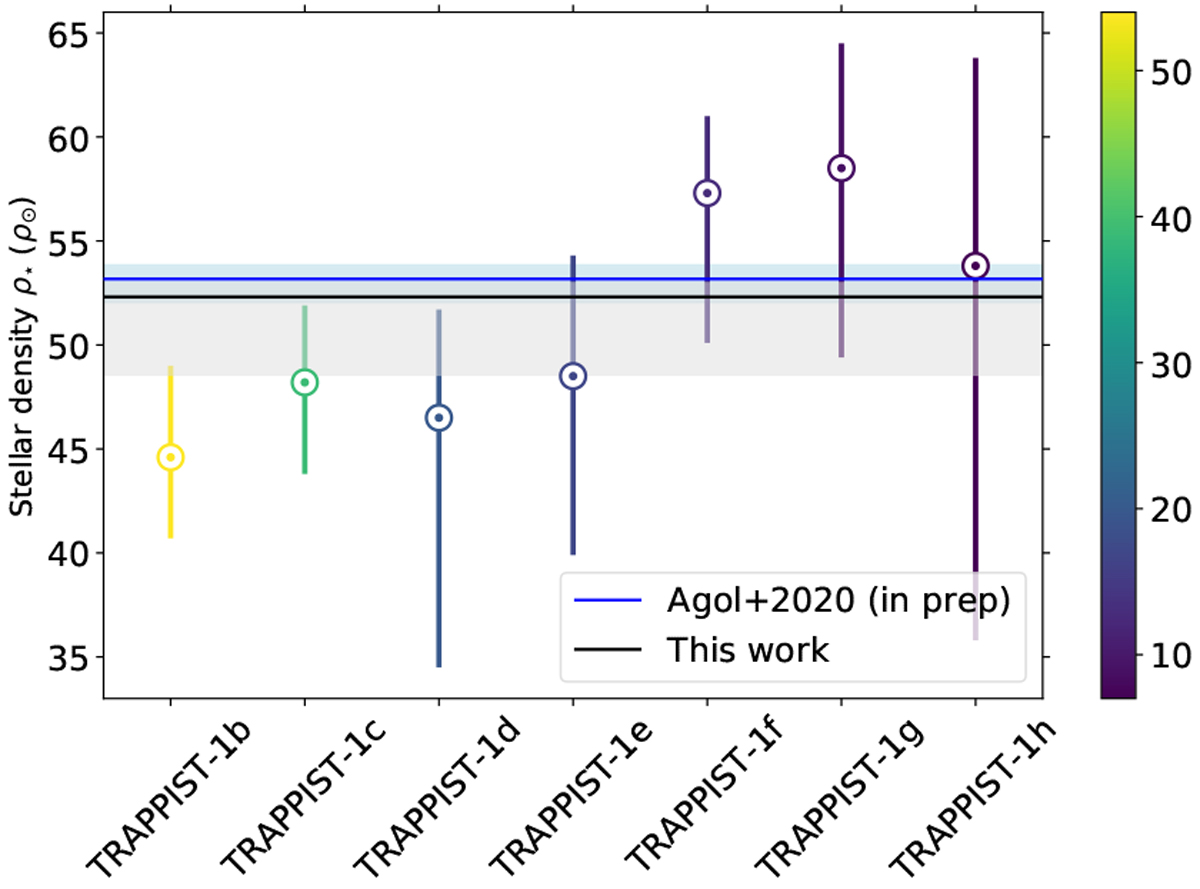
Coloured dots gives the stellar density derived from MCMC analyses of transits from a single planet, solid black line gives the density derived from a global analysis of all transits observed with its 1-σ uncertainty in gray shades. Colorbar shows the number of transits used in each analysis. Solid blue line give the stellar density value computed by Agol et al. (2020) using a photodynamical model created with the mass-ratios and orbital parameters derived from a transit-timing analysis, with its 1-σ uncertainty in blue shades.
Current usage metrics show cumulative count of Article Views (full-text article views including HTML views, PDF and ePub downloads, according to the available data) and Abstracts Views on Vision4Press platform.
Data correspond to usage on the plateform after 2015. The current usage metrics is available 48-96 hours after online publication and is updated daily on week days.
Initial download of the metrics may take a while.


