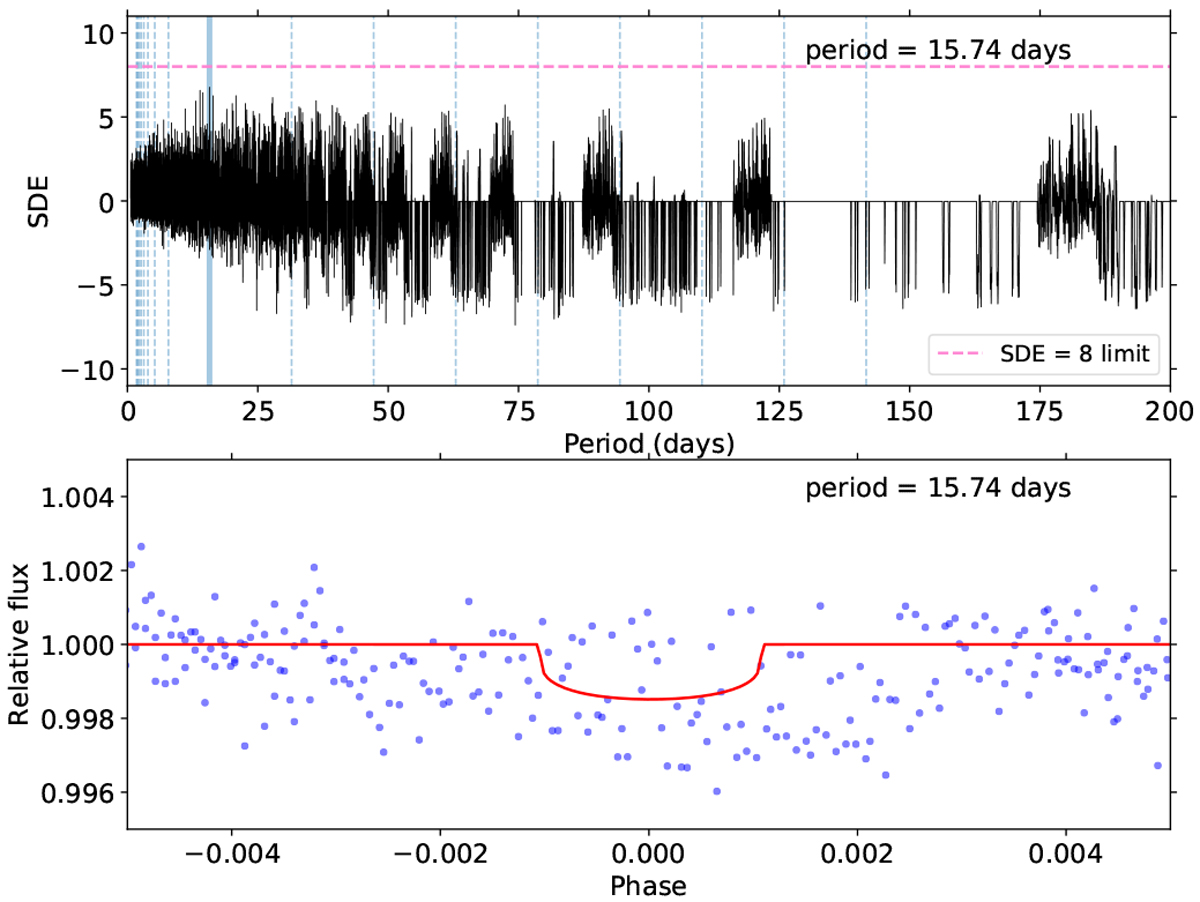
Fig. 19

Top panel: periodogram computed with the help of the Transit Least Squared (TLS) python package (Hippke & Heller 2019) applied to the time series made by the residuals of the entire Spitzer photometric (cleaned from all known transits). The x-axis is the period while the y-axis is the SignalDetection Efficiency (SDE) associated with each period. A steel-blue line indicates the harmonic for which the SED reached is the largest, here this output period is 15.74 days. Bottom panel: phase-folded transit signal for the most probable period output by the periodogram (blue dots) + transit model computed from the parameters output by the TLS algorithm (red solid line).
Current usage metrics show cumulative count of Article Views (full-text article views including HTML views, PDF and ePub downloads, according to the available data) and Abstracts Views on Vision4Press platform.
Data correspond to usage on the plateform after 2015. The current usage metrics is available 48-96 hours after online publication and is updated daily on week days.
Initial download of the metrics may take a while.


