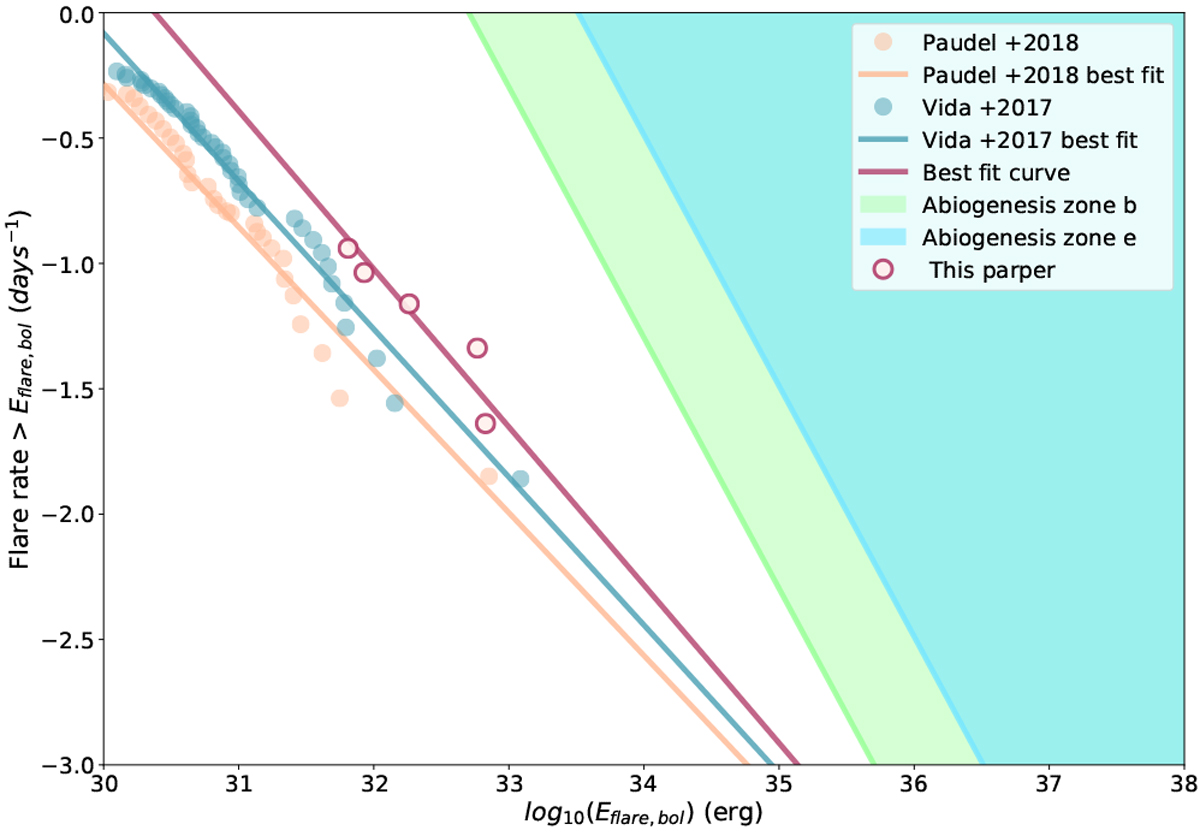
Fig. 18

Flare frequency distributions (FFD) in log–log scale. x-axis is the flare energy and y-axis is the cumulative rate of flares per day, that is to say how many flares of a corresponding energy E – or higher – happen per day. Solid lines represent the linear regressions defined by Eq. (21). The red solid line stands for the result from this work while the orange line stands for results from Paudel et al. (2018) and the green one from Vida et al. (2017). The green zone denotes the abiogenesis zone for planet TRAPPIST-1b, a zone where the inequality (Eq. (22)) is satisfied, the green bold line on the edge of the zone represent the minimum flare rate and energy required to trigger prebiotic chemistry on this planet (Rimmer et al. 2018), which corresponds mathematically to Eq. (22). The blue zone is similar to the green zone but for planet TRAPPIST-1e.
Current usage metrics show cumulative count of Article Views (full-text article views including HTML views, PDF and ePub downloads, according to the available data) and Abstracts Views on Vision4Press platform.
Data correspond to usage on the plateform after 2015. The current usage metrics is available 48-96 hours after online publication and is updated daily on week days.
Initial download of the metrics may take a while.


