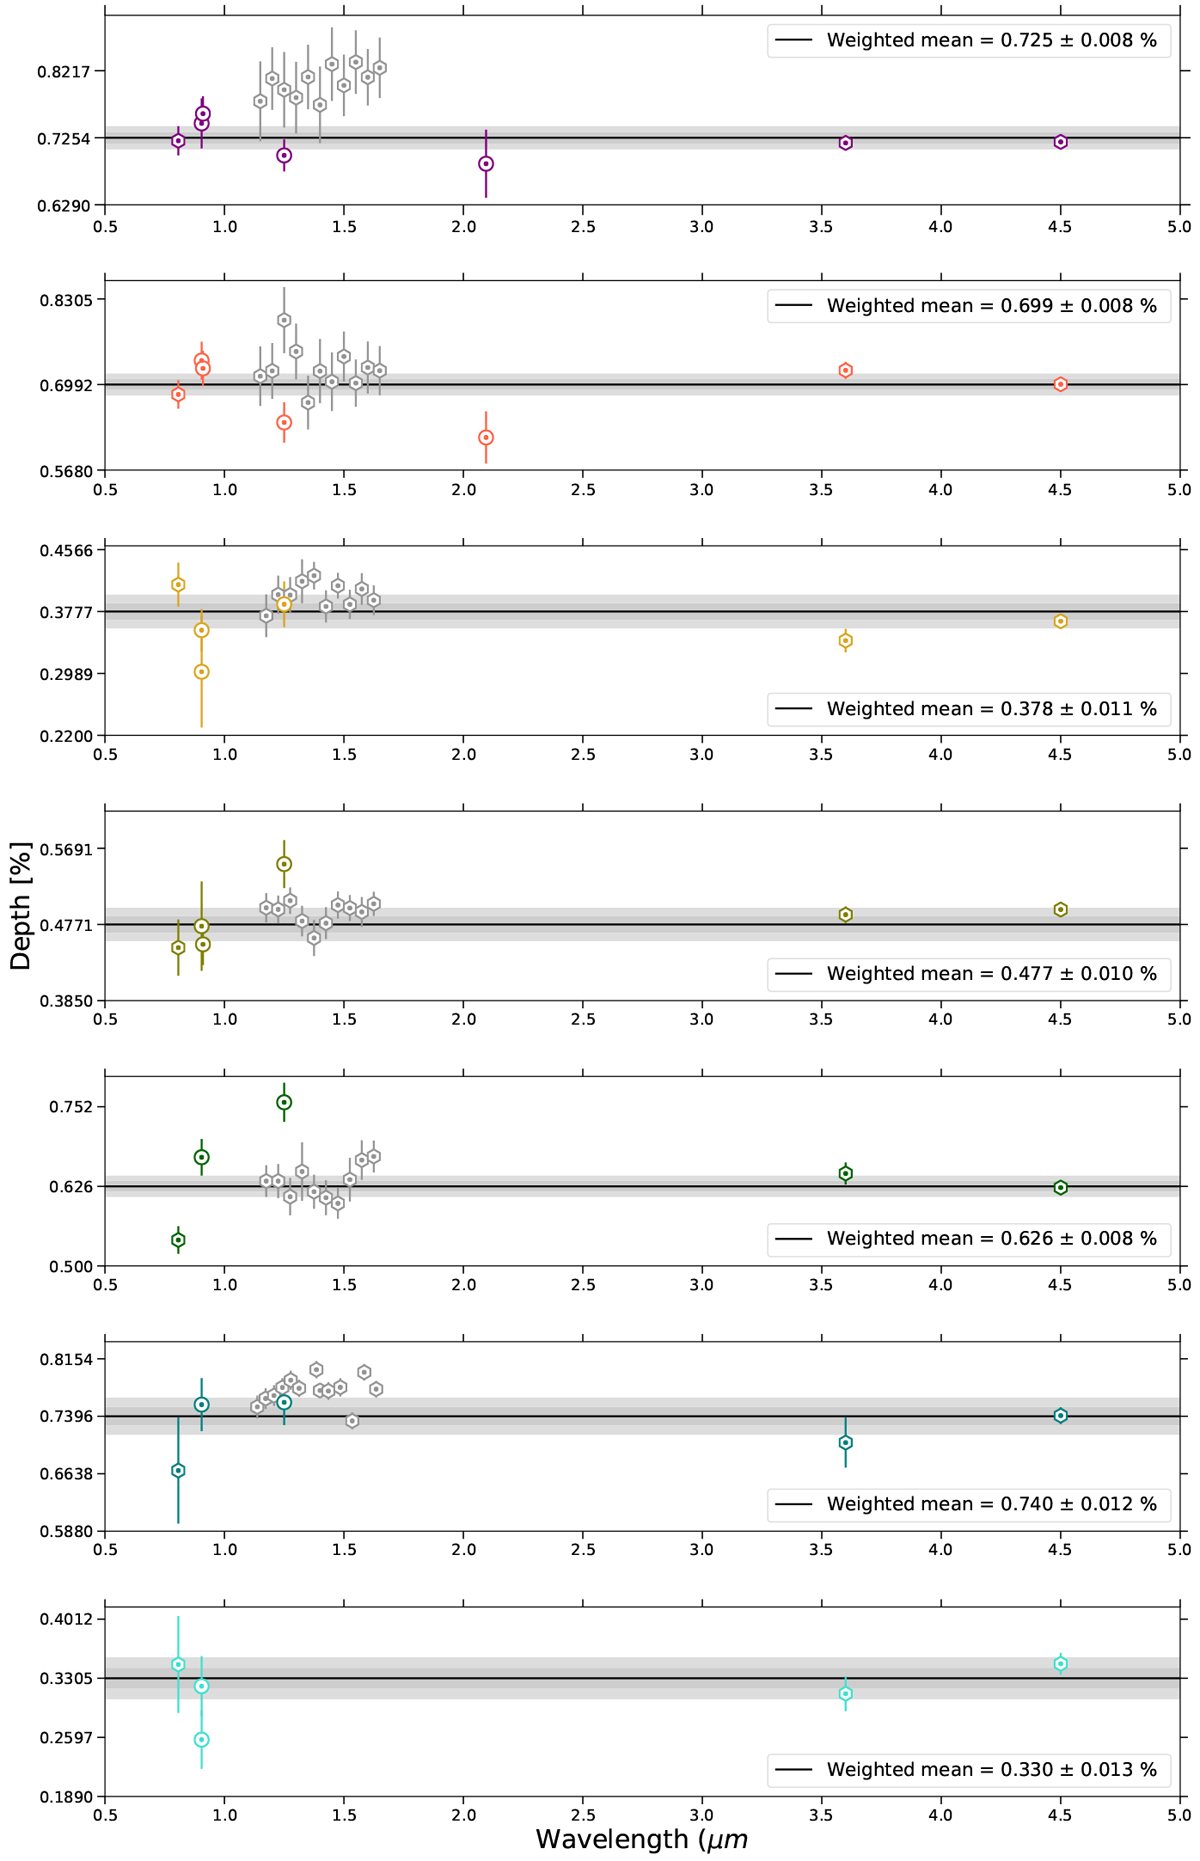
Fig. 11

Updated version of the transit transmission spectra of the seven TRAPPIST-1 planets. In each subplot the continuous line is the weighted mean depth ![]() of all non-HST measurements, with its 1-σ and 2-σ confidence intervals, in shades of gray calculated from the following formula
of all non-HST measurements, with its 1-σ and 2-σ confidence intervals, in shades of gray calculated from the following formula
![]() ,
σi and wi being respectively the error of measure i and its weight (i.e number of transits observed at each wavelength). HST measurements are presented as gray points. Coloured dots stand for the measured transit depth at the effective wavelength of the instrument, ground based measurement are symbolized by circles and space based measurement by hexagons. Each point is associated with a particular observation, in ascending order of wavelength: one point for K2 (value from Ducrot et al. 2018), one for SSO (value from Ducrot et al. 2018), one for LT (value from Ducrot et al. 2018), one in the
J-band for UKIRT/WFCAM and/or AAT (value from Burdanov et al. 2019), one for the NB-2090 filter band, one point for VLT/HAWK-I only for planet b and c (value from Burdanov et al. 2019), in IR 11 points for b and c, 10 for d, e, f and 13 for gtaken with HST/WFC3 (values from de Wit et al. 2016, 2018; Wakeford et al. 2018) and two points for
Spitzer/IRAC channel 1 and 2 (values from this work, Table 6).
,
σi and wi being respectively the error of measure i and its weight (i.e number of transits observed at each wavelength). HST measurements are presented as gray points. Coloured dots stand for the measured transit depth at the effective wavelength of the instrument, ground based measurement are symbolized by circles and space based measurement by hexagons. Each point is associated with a particular observation, in ascending order of wavelength: one point for K2 (value from Ducrot et al. 2018), one for SSO (value from Ducrot et al. 2018), one for LT (value from Ducrot et al. 2018), one in the
J-band for UKIRT/WFCAM and/or AAT (value from Burdanov et al. 2019), one for the NB-2090 filter band, one point for VLT/HAWK-I only for planet b and c (value from Burdanov et al. 2019), in IR 11 points for b and c, 10 for d, e, f and 13 for gtaken with HST/WFC3 (values from de Wit et al. 2016, 2018; Wakeford et al. 2018) and two points for
Spitzer/IRAC channel 1 and 2 (values from this work, Table 6).
Current usage metrics show cumulative count of Article Views (full-text article views including HTML views, PDF and ePub downloads, according to the available data) and Abstracts Views on Vision4Press platform.
Data correspond to usage on the plateform after 2015. The current usage metrics is available 48-96 hours after online publication and is updated daily on week days.
Initial download of the metrics may take a while.


