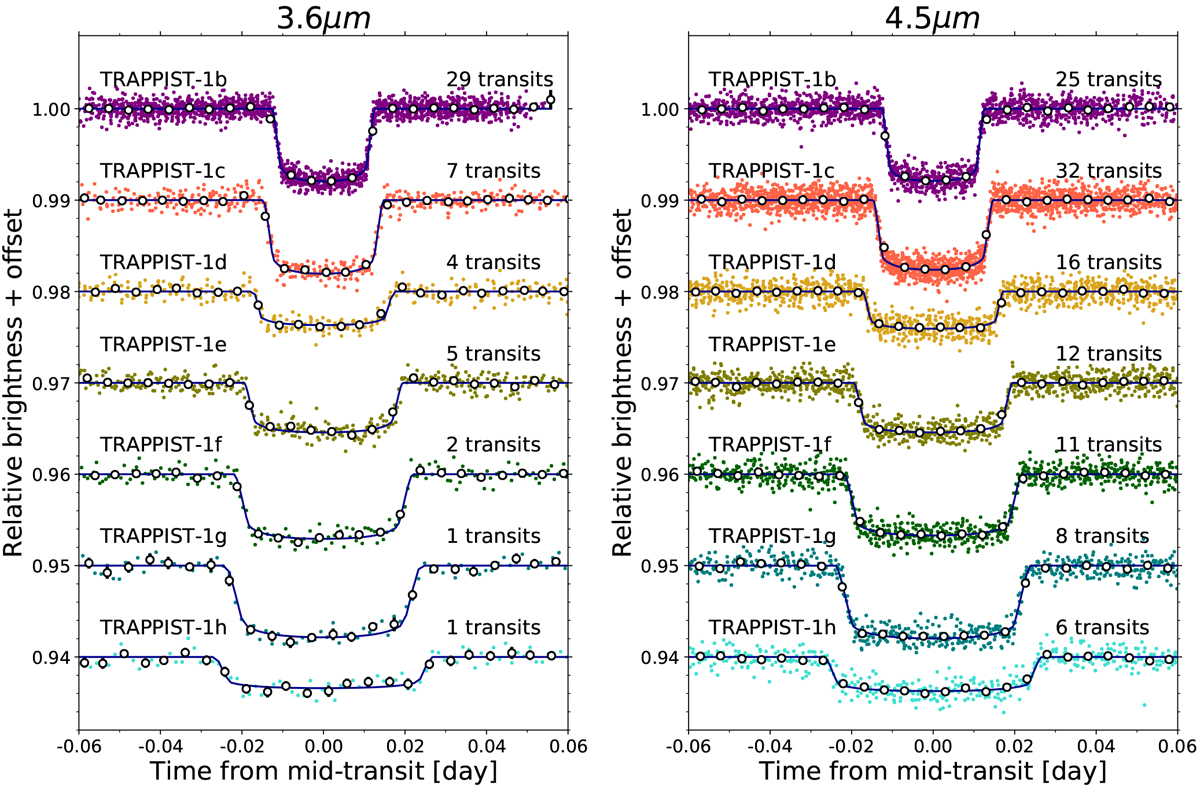
Fig. 10

Left: period-folded photometric measurements obtained with Spitzer/IRAC channel 1 (at 3.6 μm) near thetransits of the seven planets, corrected for the measured TTVs. Colored dots show the unbinned measurements; open circles depict the measurements binned over 5 min for visual clarity. The best-fit transit models are shown as dark blue lines. The numbers of transits that were observed to produce these combined curves are written on the plot. Right: similarly at 4.5 μm.
Current usage metrics show cumulative count of Article Views (full-text article views including HTML views, PDF and ePub downloads, according to the available data) and Abstracts Views on Vision4Press platform.
Data correspond to usage on the plateform after 2015. The current usage metrics is available 48-96 hours after online publication and is updated daily on week days.
Initial download of the metrics may take a while.


