Fig. 4.
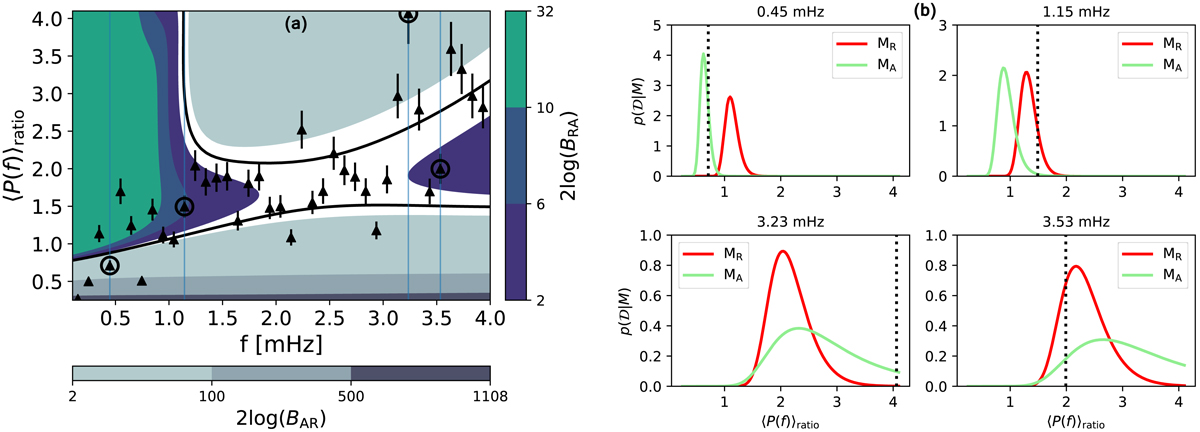
Panel a: filled contour with the distribution of Bayes factors, BRA and BAR, over the two-dimensional data space 𝒟. Solid lines connect points with p(𝒟|MR) = p(𝒟|MA) (Bayes factor equal to zero). The computations are performed over a grid of points (Nf = 80, N⟨P(f)⟩ratio = 155) over the ranges f ∈ [0.05, 4] and ⟨P(f)⟩ratio ∈ [0.25, 4.1]. The priors are p(ξE)∼𝒢(1.9, 0.3) for MR and p(ξE)∼𝒢(4.3, 0.6); p(R0)∼𝒢(0.5, 0.02) for MA. Triangles represent CoMP data. The error model for observed and synthetic average power ratio is the same adopted in the inference analysis, Sect. 3.1. Following Kass & Raftery (1995), the evidence in favour of a model, i, in front of an alternative, j, is inconclusive for values of 2log(Bij) from 0 to 2; positive from 2 to 6; strong from 6 to 10; and very strong for values above 10. Panel b: marginal likelihood for models MR and MA for the data points circled in (a) as a function of average power ratio. The vertical dotted lines are the CoMP average power ratio values.
Current usage metrics show cumulative count of Article Views (full-text article views including HTML views, PDF and ePub downloads, according to the available data) and Abstracts Views on Vision4Press platform.
Data correspond to usage on the plateform after 2015. The current usage metrics is available 48-96 hours after online publication and is updated daily on week days.
Initial download of the metrics may take a while.