Fig. 2.
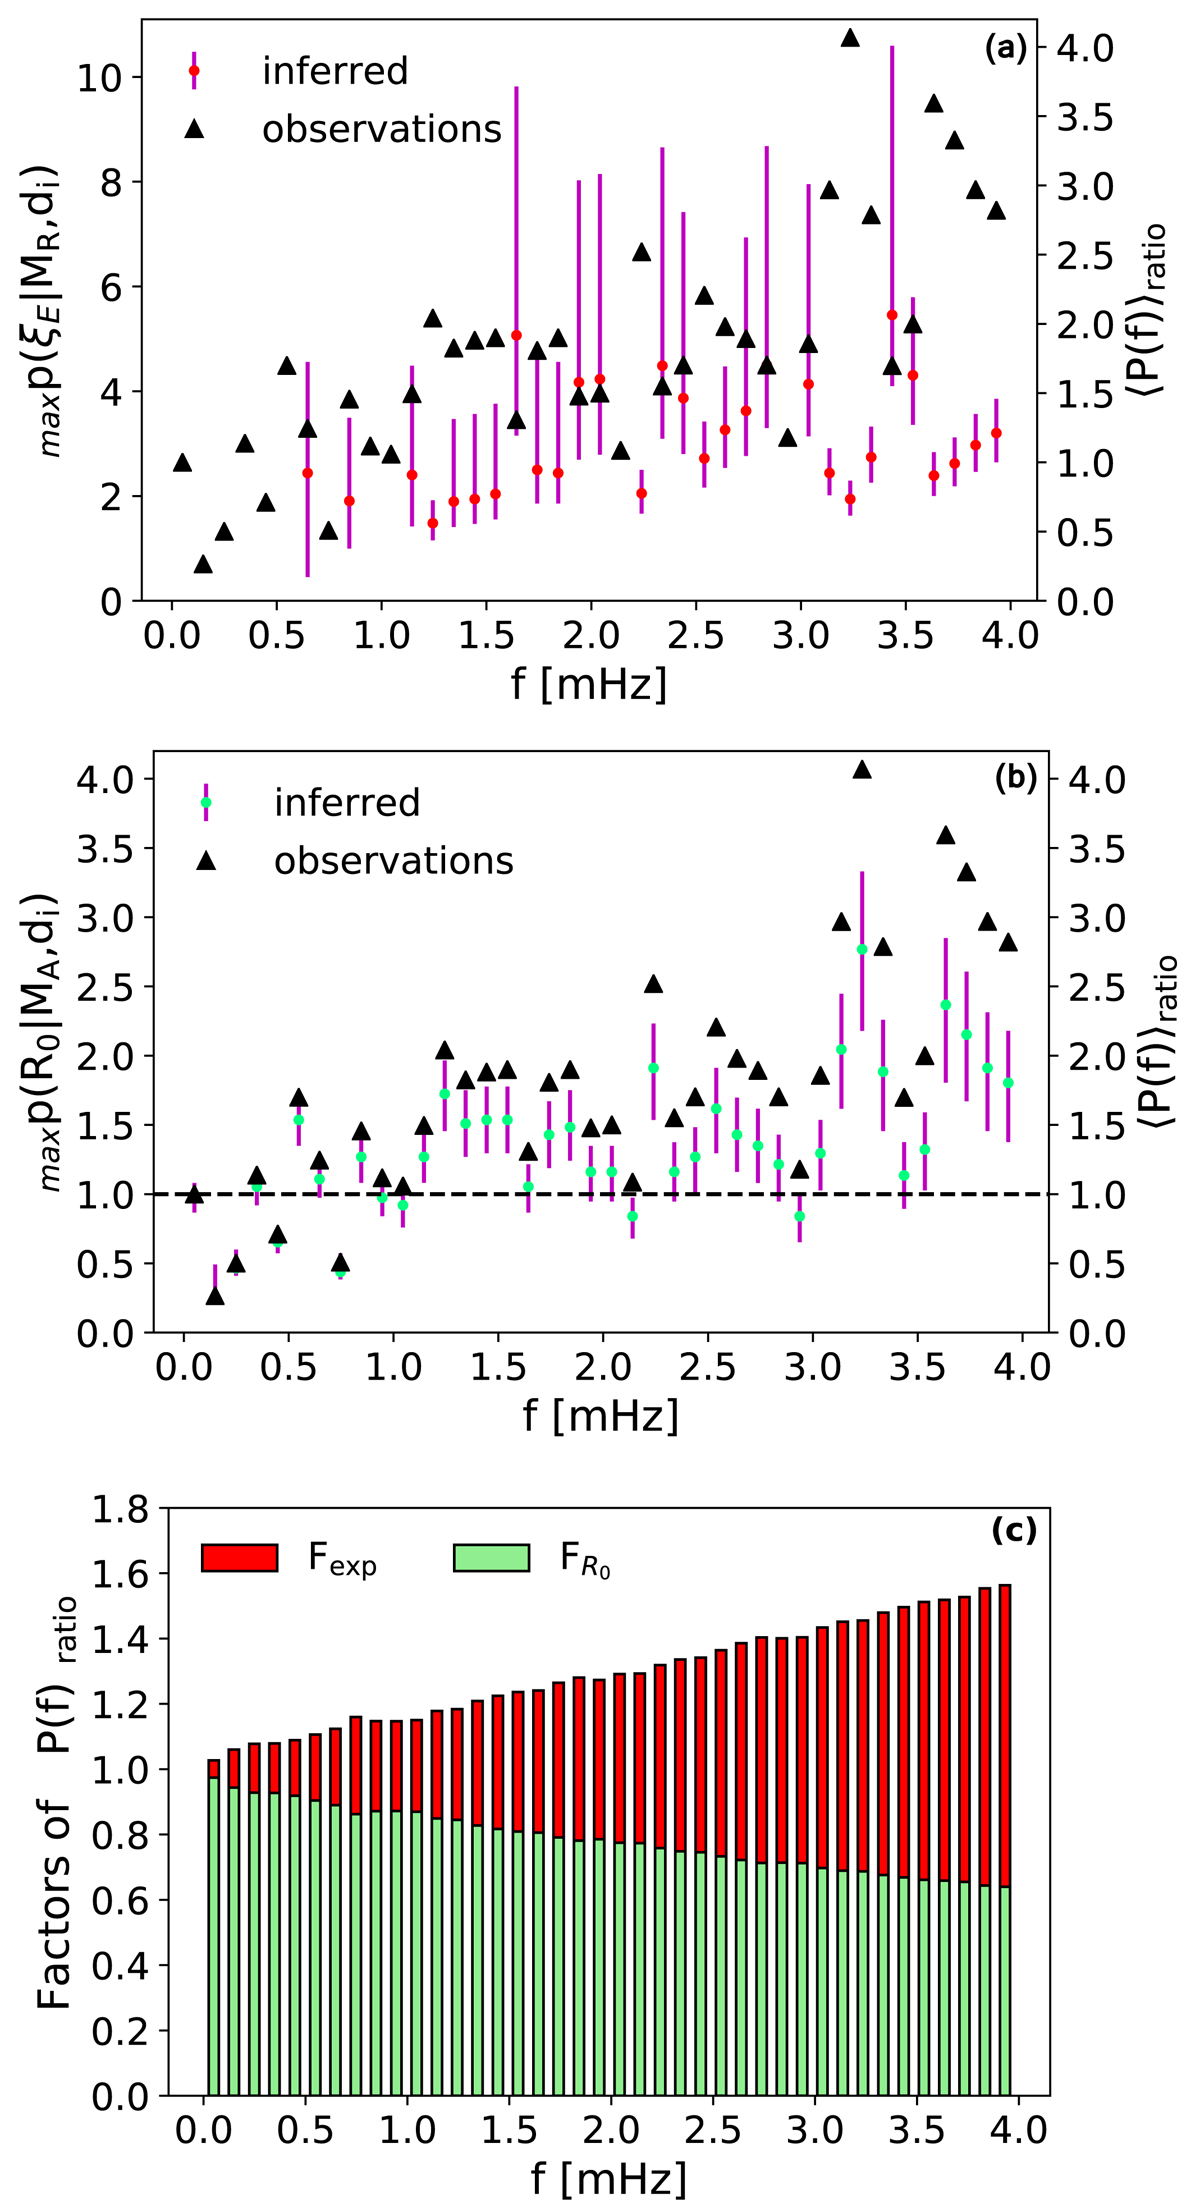
Panels a and b: inferences of damping ratio and power ratio at foot-points using CoMP data for average power ratio at different frequencies (triangles). The red and green dots are the maximum a posteriori estimates with uncertainty at the 68% credible interval (purple bars). Panel a: the inference is restricted to ⟨P(f)⟩ratio > 1.2. Panel b: the horizontal dashed line is at ⟨P(f)⟩ratio = 1. Panel c: estimates of fractional contribution from power ratio at foot-points, FR0, and absolute contribution from resonant damping, Fexp.
Current usage metrics show cumulative count of Article Views (full-text article views including HTML views, PDF and ePub downloads, according to the available data) and Abstracts Views on Vision4Press platform.
Data correspond to usage on the plateform after 2015. The current usage metrics is available 48-96 hours after online publication and is updated daily on week days.
Initial download of the metrics may take a while.