Fig. 9.
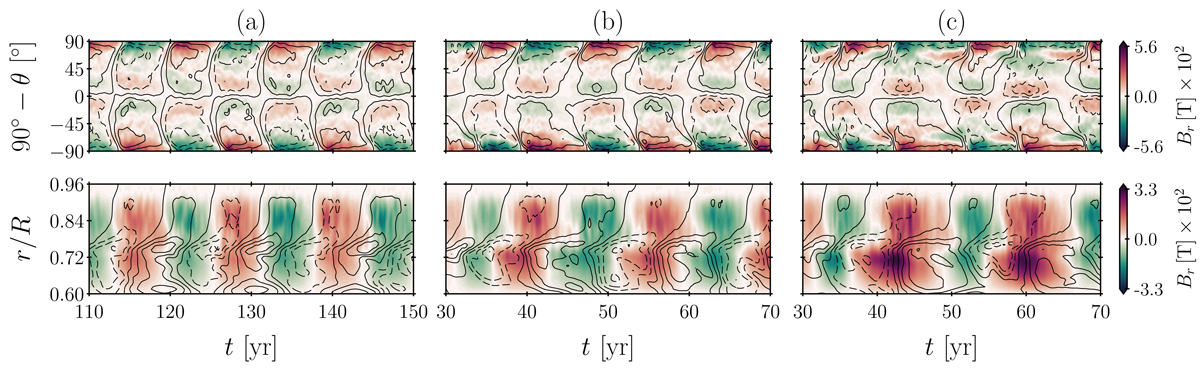
Time latitude at r = 0.90R (upper panels), and time radius at θ = 15° latitude (lower panels), butterfly diagrams comparing the magnetic field evolution between simulations (a) P29, (b) P25, and (c) P21. The colored contours show the radial magnetic field intensity. The solid (dashed) lines show the positive (negative) contours of toroidal magnetic field.
Current usage metrics show cumulative count of Article Views (full-text article views including HTML views, PDF and ePub downloads, according to the available data) and Abstracts Views on Vision4Press platform.
Data correspond to usage on the plateform after 2015. The current usage metrics is available 48-96 hours after online publication and is updated daily on week days.
Initial download of the metrics may take a while.