Free Access
Fig. 5.
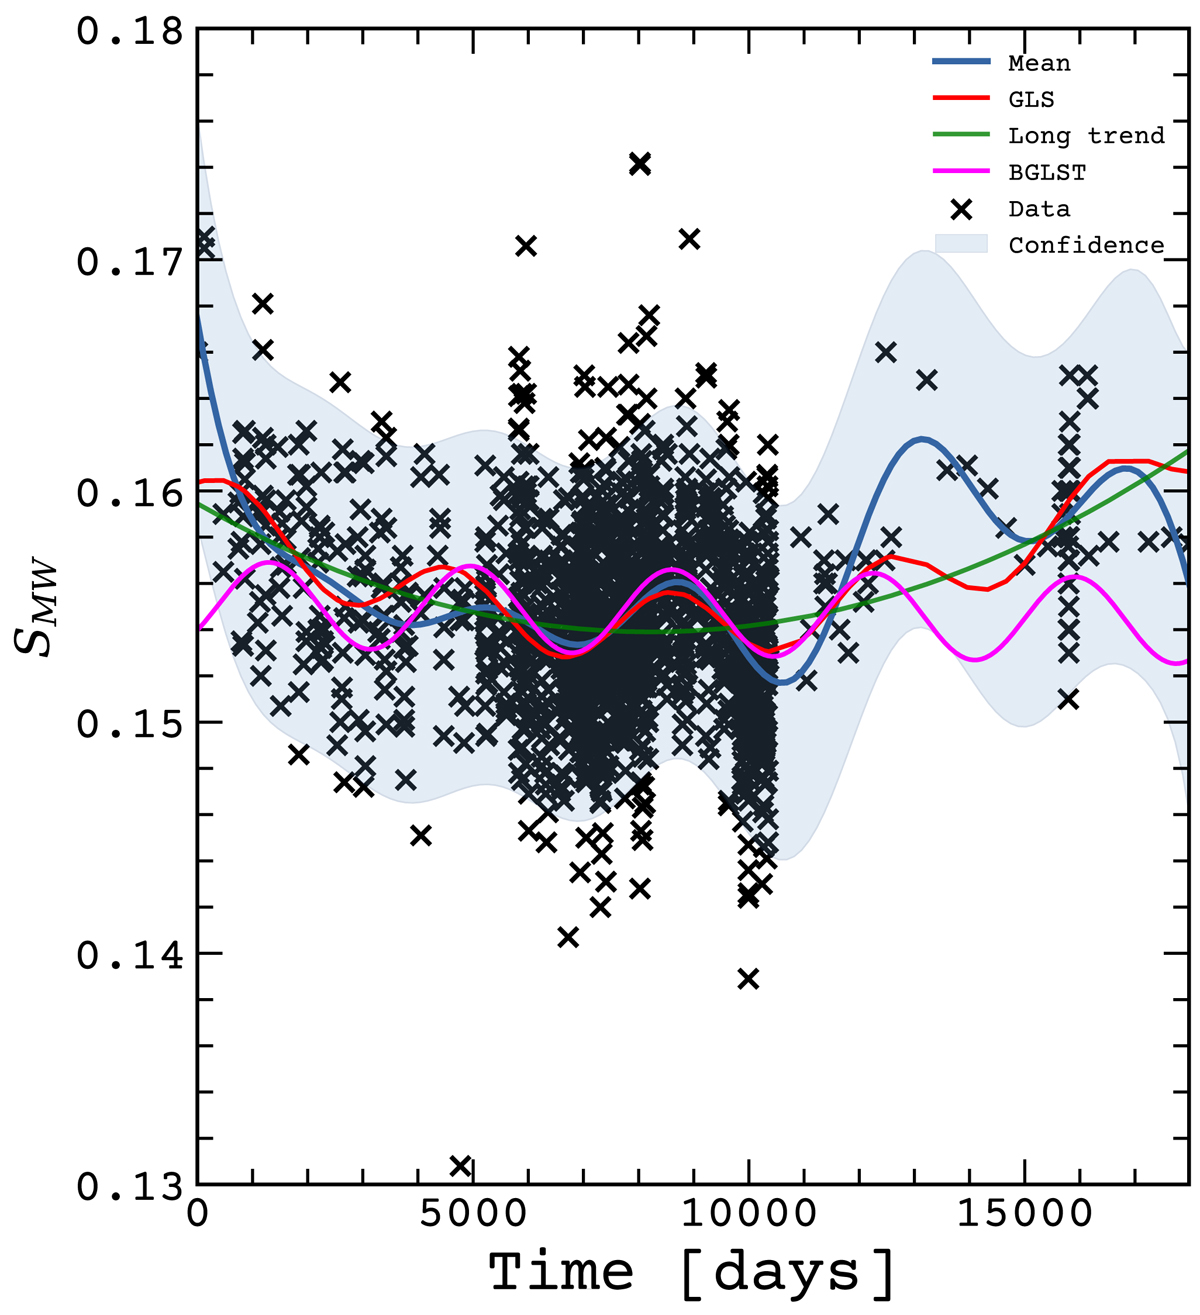
Comparison between the analysis made with the GLS, GP, and BGLST methods. The green line shows the long trend fit, the red line is a sinusoidal representative fit created with GLS, the magenta line is the BGLST fit. The blue line represents the GP mean, and the blue shaded region is the confidence region from the GP fit.
Current usage metrics show cumulative count of Article Views (full-text article views including HTML views, PDF and ePub downloads, according to the available data) and Abstracts Views on Vision4Press platform.
Data correspond to usage on the plateform after 2015. The current usage metrics is available 48-96 hours after online publication and is updated daily on week days.
Initial download of the metrics may take a while.