Fig. 4.
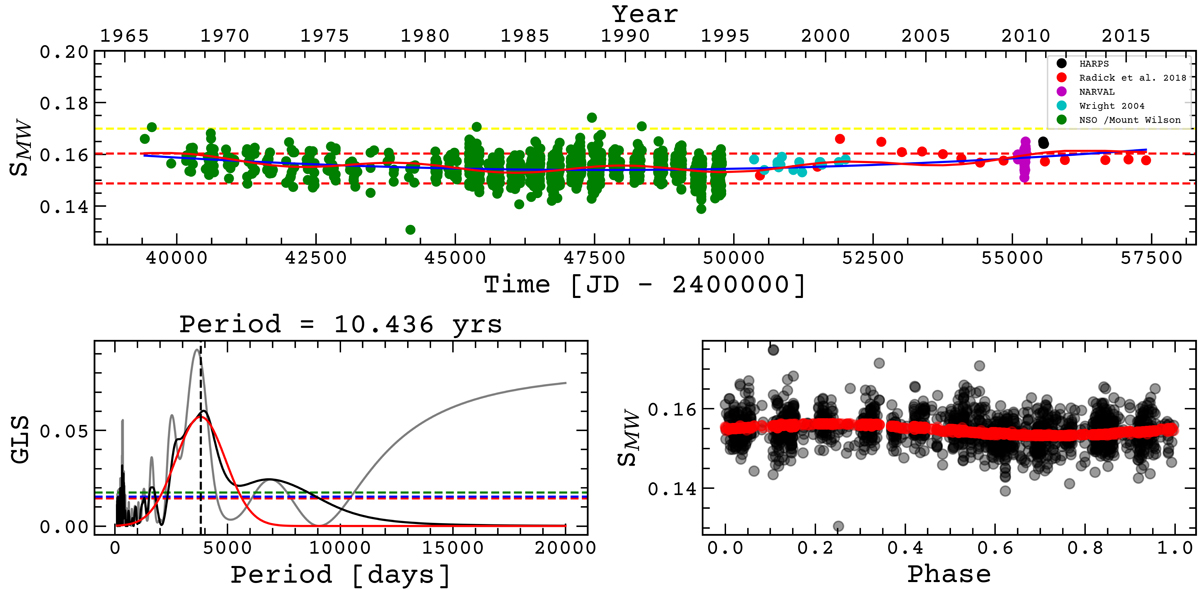
Entire spectroscopic chromospheric activity measurements with the Sindex calibrated to the Mt. Wilson Scale for HD 43587 between 1966 and 2016. Upper panel: all measurements from Duncan et al. (1991), Wright (2004), Hall (2008), and Radick et al. (2018), combined with the computed SMW from the NARVAl and HARPS spectra archives. The red solid line is the sinusoidal curve fitting for 10.436 yr, the blue solid line is the long-term trend found to be larger than 50 yr. The yellow dashed line shows the mean SMW for the Sun. Bottom left panel: GLS periodogram of the whole SMW time series (solid gray line), and removing the long trend of over 50 years (solid black line). The Gaussian fit (solid red line) of this second periodogram indicates an activity cycle of 10.436 years (vertical black dashed line). Bottom-right panel: phase of the SMW (black circles) and the folded fit with the found period (red circles).
Current usage metrics show cumulative count of Article Views (full-text article views including HTML views, PDF and ePub downloads, according to the available data) and Abstracts Views on Vision4Press platform.
Data correspond to usage on the plateform after 2015. The current usage metrics is available 48-96 hours after online publication and is updated daily on week days.
Initial download of the metrics may take a while.