Fig. 3.
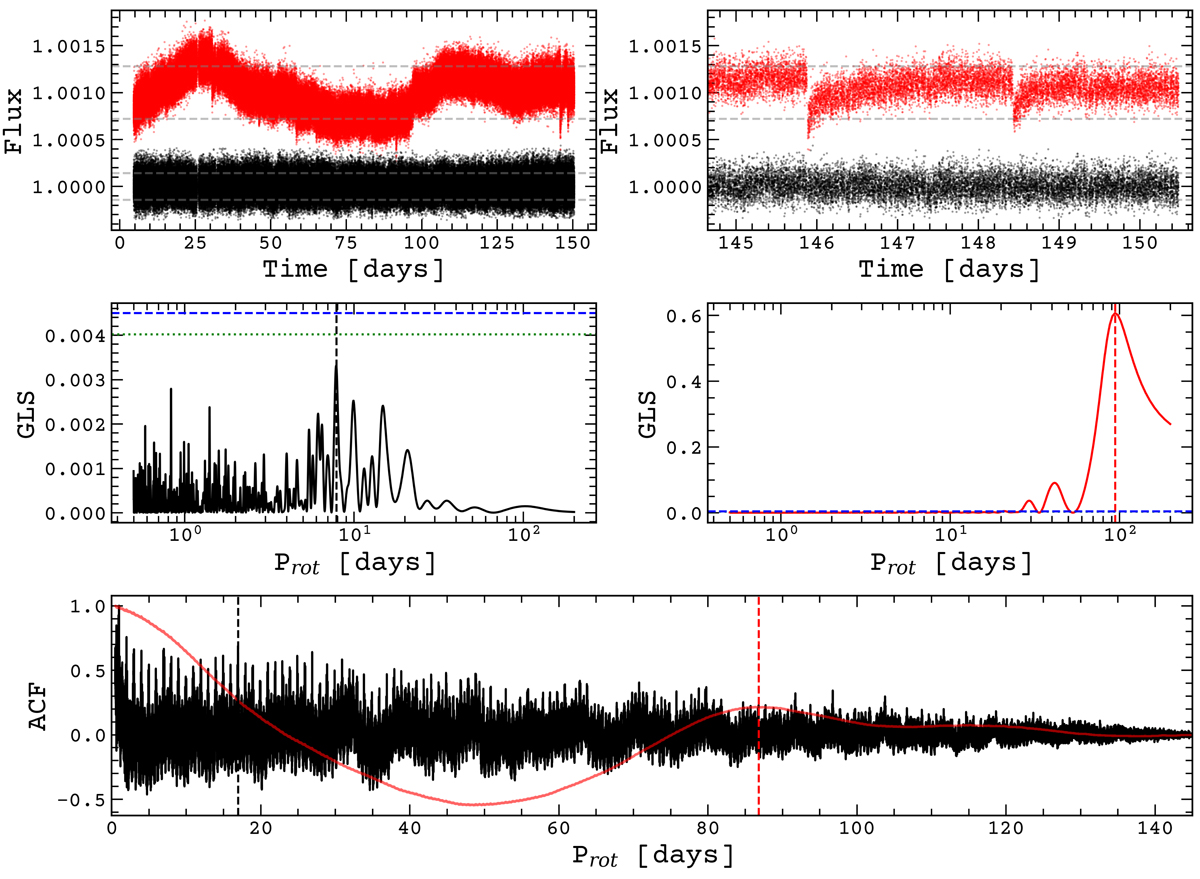
CoRoT light curve of HD 43587. Top-left panel: raw light curve including discontinuities (red dots) and the detrended light curve (black dots). Top-right panel: detail of the discontinuities at the end of the light curve (red dots) and the flat aspect of the curve after the reduction (black dots). Middle-left panel: GLS periodogram for the detrended light curve with false alarm probability of 5% and 1% (green dots and blue dashed line, respectively). Middle-right panel: GLS periodogram for raw light curve with false alarm probability the same as the detrended analysis. Bottom panel: ACF periodogram for the same two reductions.
Current usage metrics show cumulative count of Article Views (full-text article views including HTML views, PDF and ePub downloads, according to the available data) and Abstracts Views on Vision4Press platform.
Data correspond to usage on the plateform after 2015. The current usage metrics is available 48-96 hours after online publication and is updated daily on week days.
Initial download of the metrics may take a while.