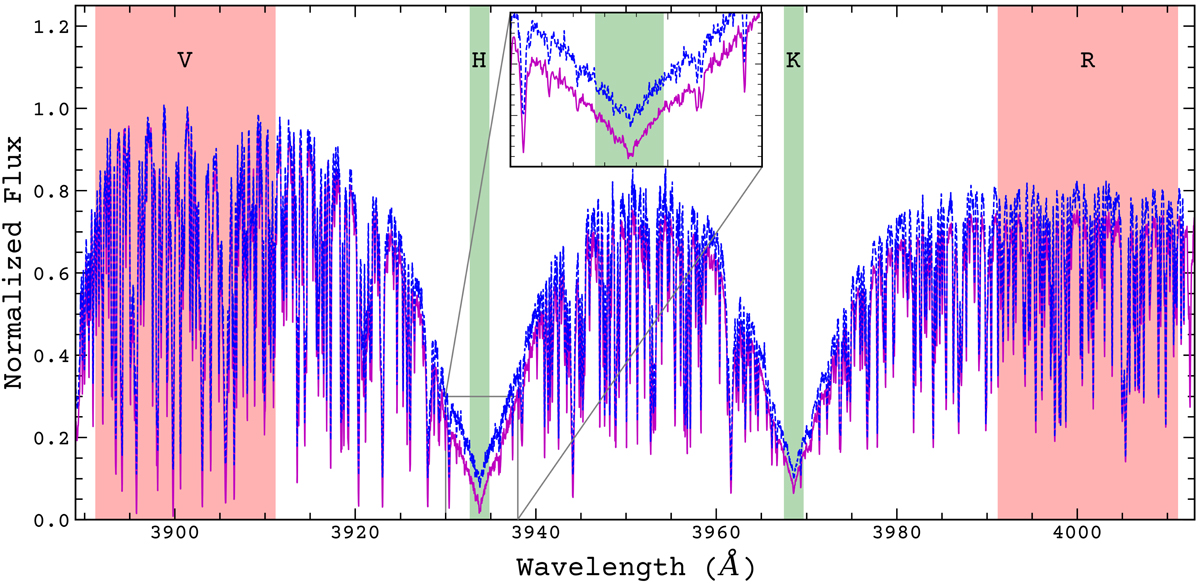
Fig. 2.

HD 43587 spectra from NARVAL spectrograph. The magenta spectrum corresponds to the maximum SMW value of the dataset, observed on February 13, 2010. The blue spectrum corresponds to the minimum SMW value, observed on January 18, 2010. Both spectra were normalized from 3889 Å to 4013 Å. An upward shift in flux of 0.05 was applied in the blue spectra to better visualization. The inset panel shows the region between 3930 Å and 3938 Å in detail.
Current usage metrics show cumulative count of Article Views (full-text article views including HTML views, PDF and ePub downloads, according to the available data) and Abstracts Views on Vision4Press platform.
Data correspond to usage on the plateform after 2015. The current usage metrics is available 48-96 hours after online publication and is updated daily on week days.
Initial download of the metrics may take a while.


