Fig. 10.
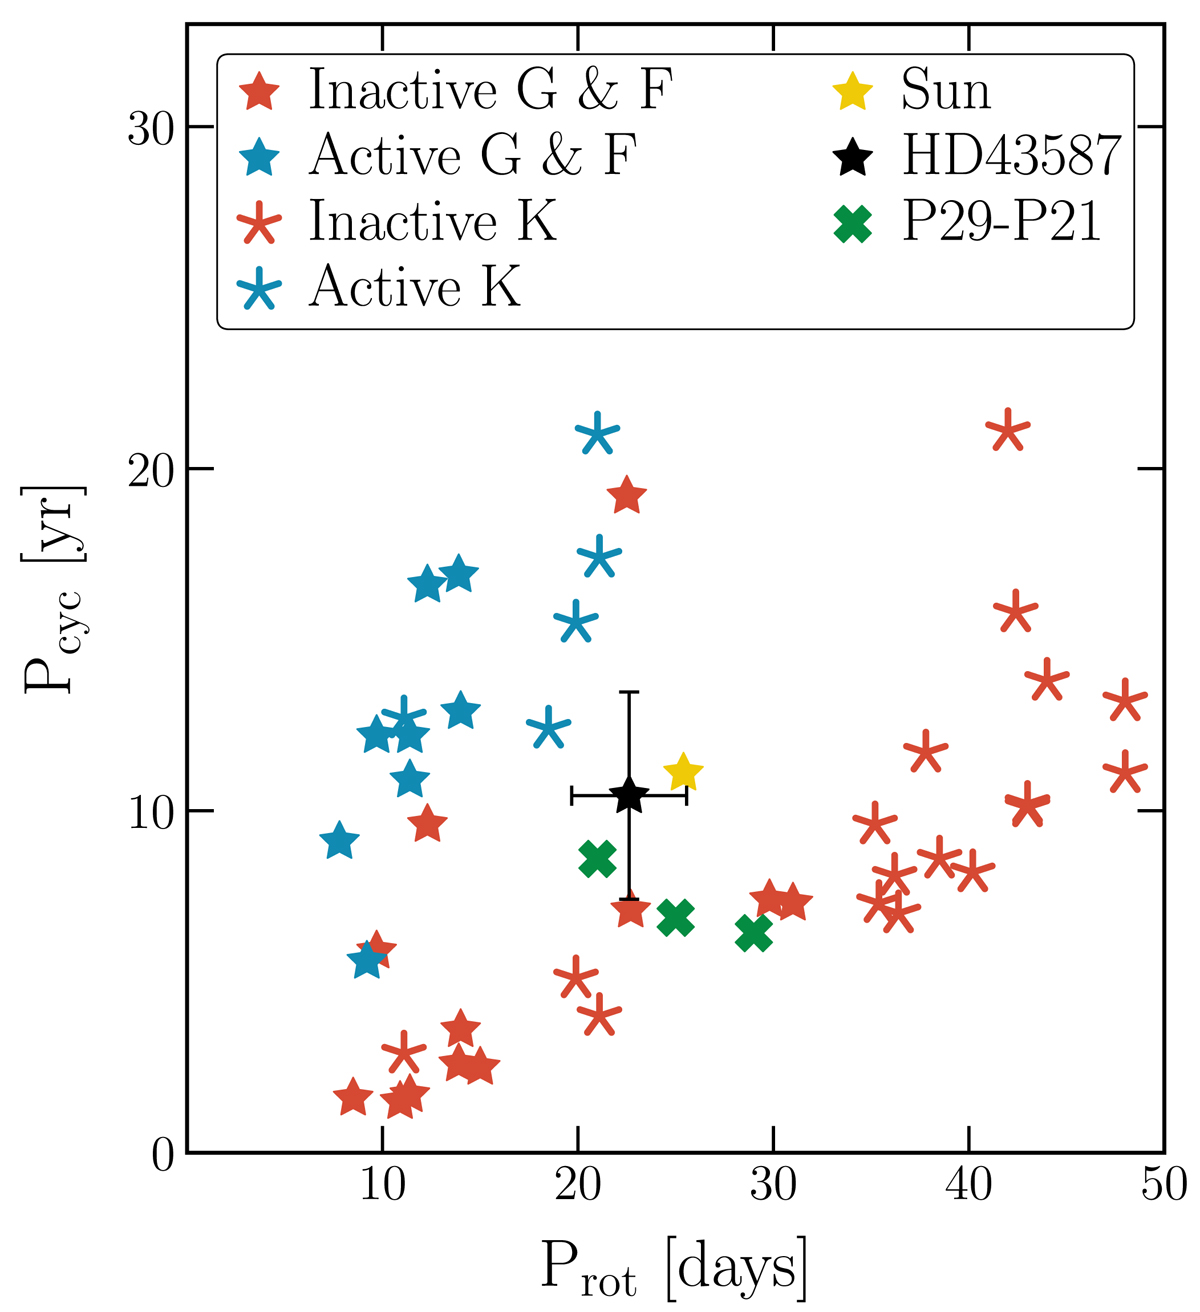
Correlation between Pcyc and Prot for the simulations presented in Table 2 (green points). The blue and red points correspond to F, G, and K star data as presented in Brandenburg et al. (2017). The black star shows the position of HD 43587 with the values inferred in this work, and the yellow point marks the position of the Sun.
Current usage metrics show cumulative count of Article Views (full-text article views including HTML views, PDF and ePub downloads, according to the available data) and Abstracts Views on Vision4Press platform.
Data correspond to usage on the plateform after 2015. The current usage metrics is available 48-96 hours after online publication and is updated daily on week days.
Initial download of the metrics may take a while.