Fig. 1.
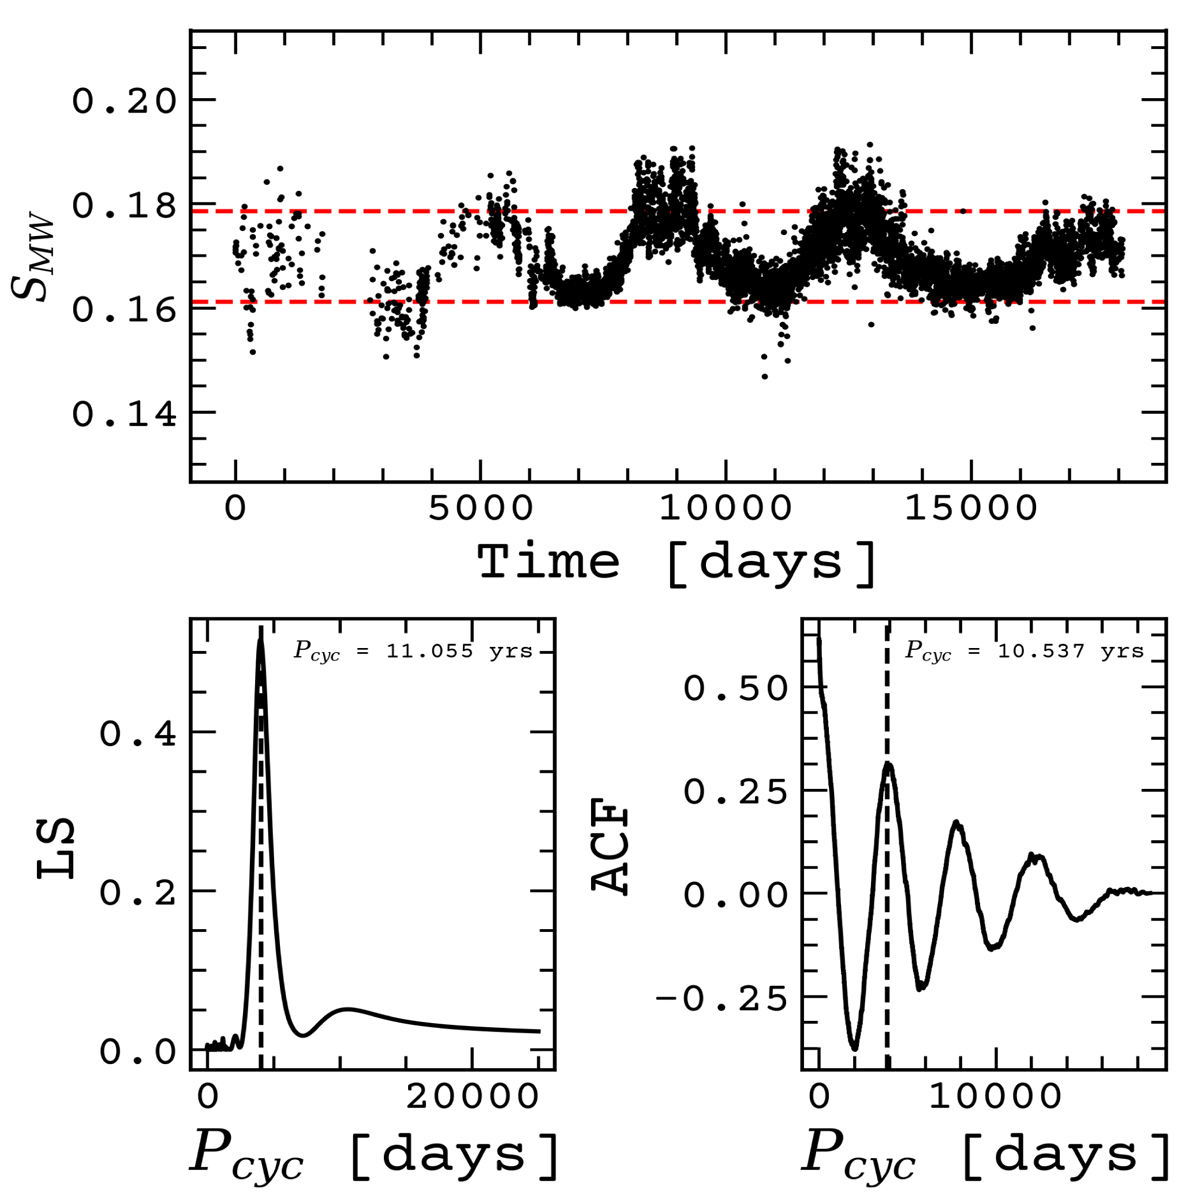
Sun’s chromospheric activity over 50 years according to Egeland et al. (2017). Upper: complete time series measurements made over 50 years depicting the SMW periodic profile. Bottom: both the Lomb-Scargle (left), and the autocorrelation function (ACF, see Brockwell 2002) (right) periodograms showing the Pcyc ≈ 11 yr solar activity cycle.
Current usage metrics show cumulative count of Article Views (full-text article views including HTML views, PDF and ePub downloads, according to the available data) and Abstracts Views on Vision4Press platform.
Data correspond to usage on the plateform after 2015. The current usage metrics is available 48-96 hours after online publication and is updated daily on week days.
Initial download of the metrics may take a while.